getDesignGroupSequential()
getDesignInverseNormal()
getDesignFisher()
getDesignConditionalDunnett()Deep Dive into our Products
Where Statistical Innovation Meets Open Source Excellence
April 13, 2026
The R Package rpact

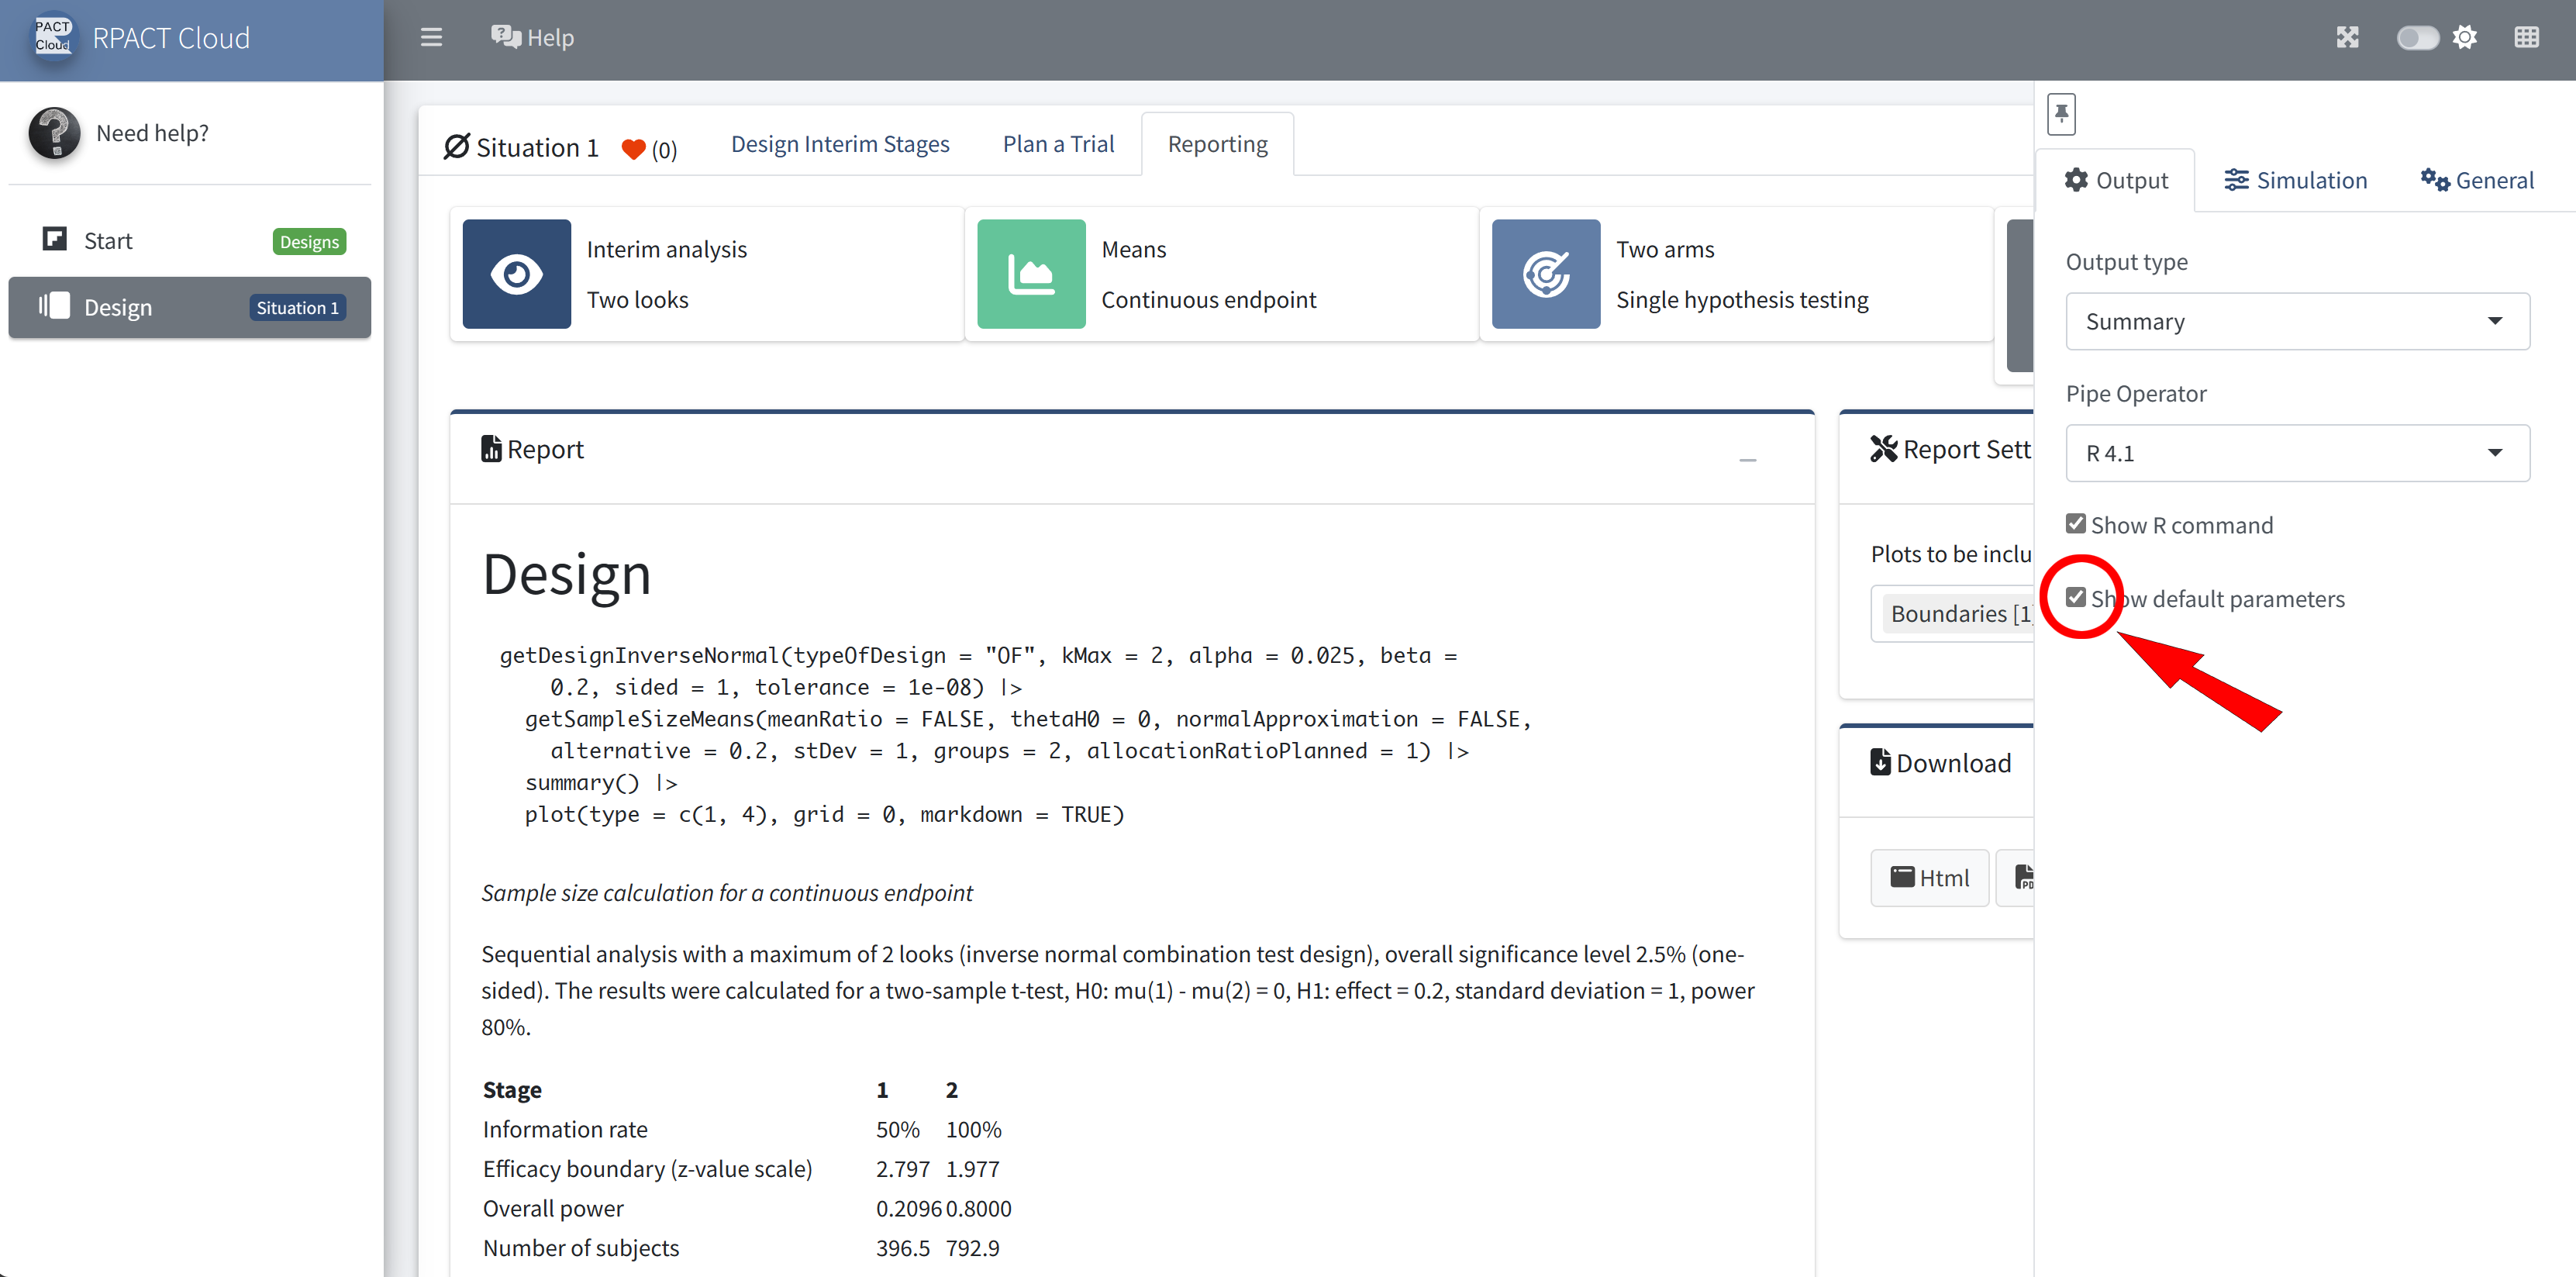
User Concept – Most parameters have a default value
Example: getDesignInverseNormal() produces the output:
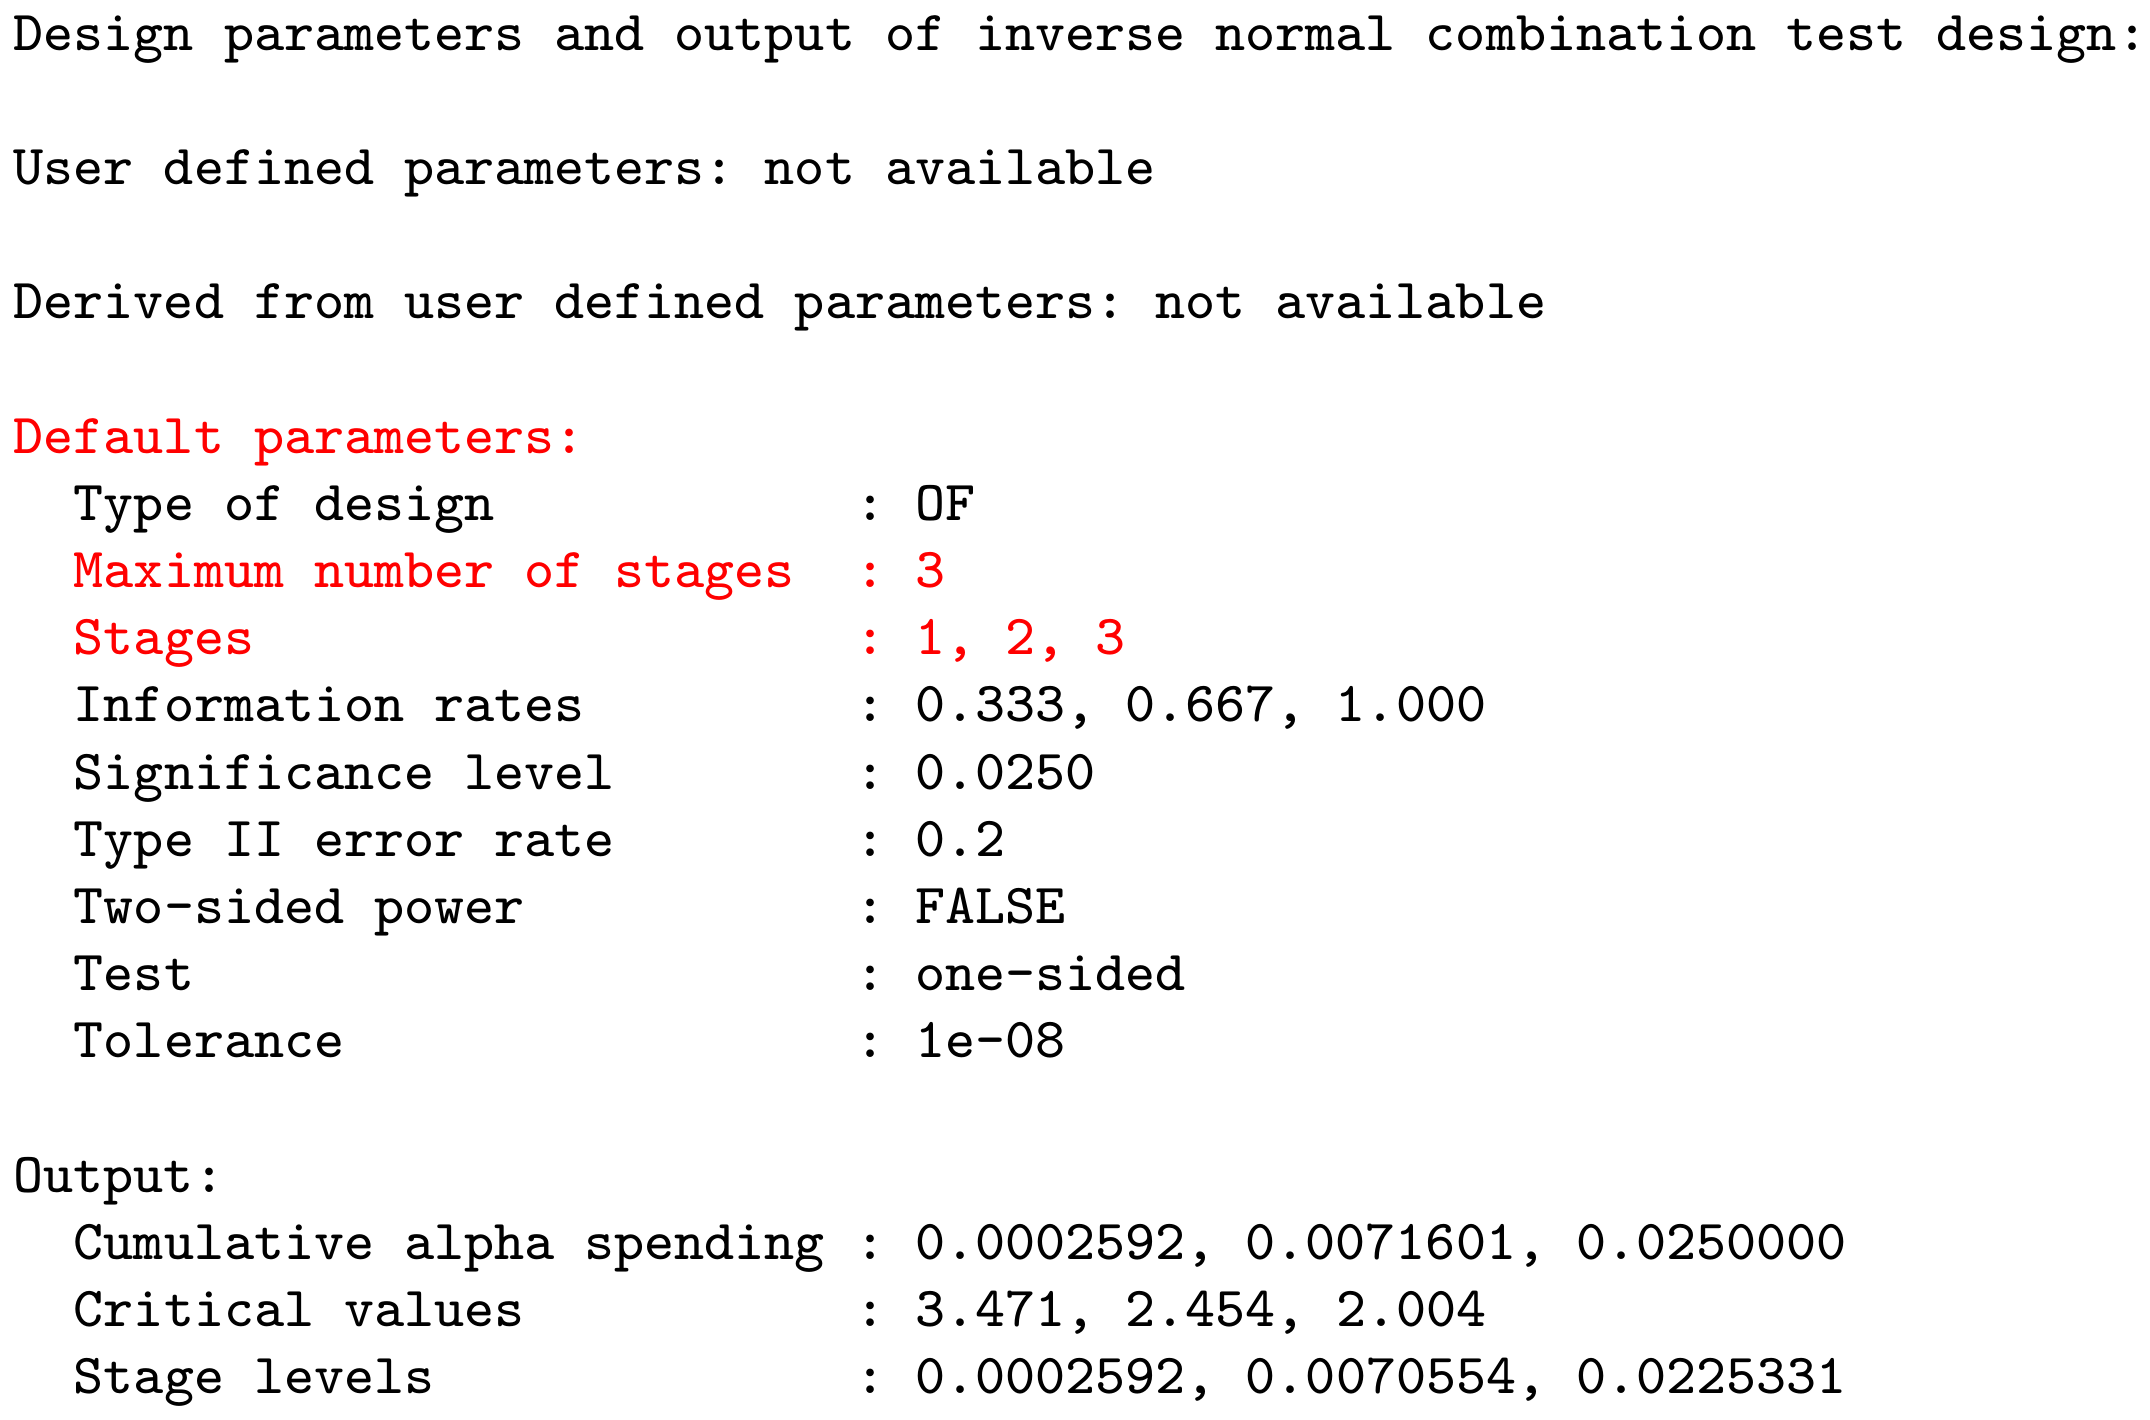
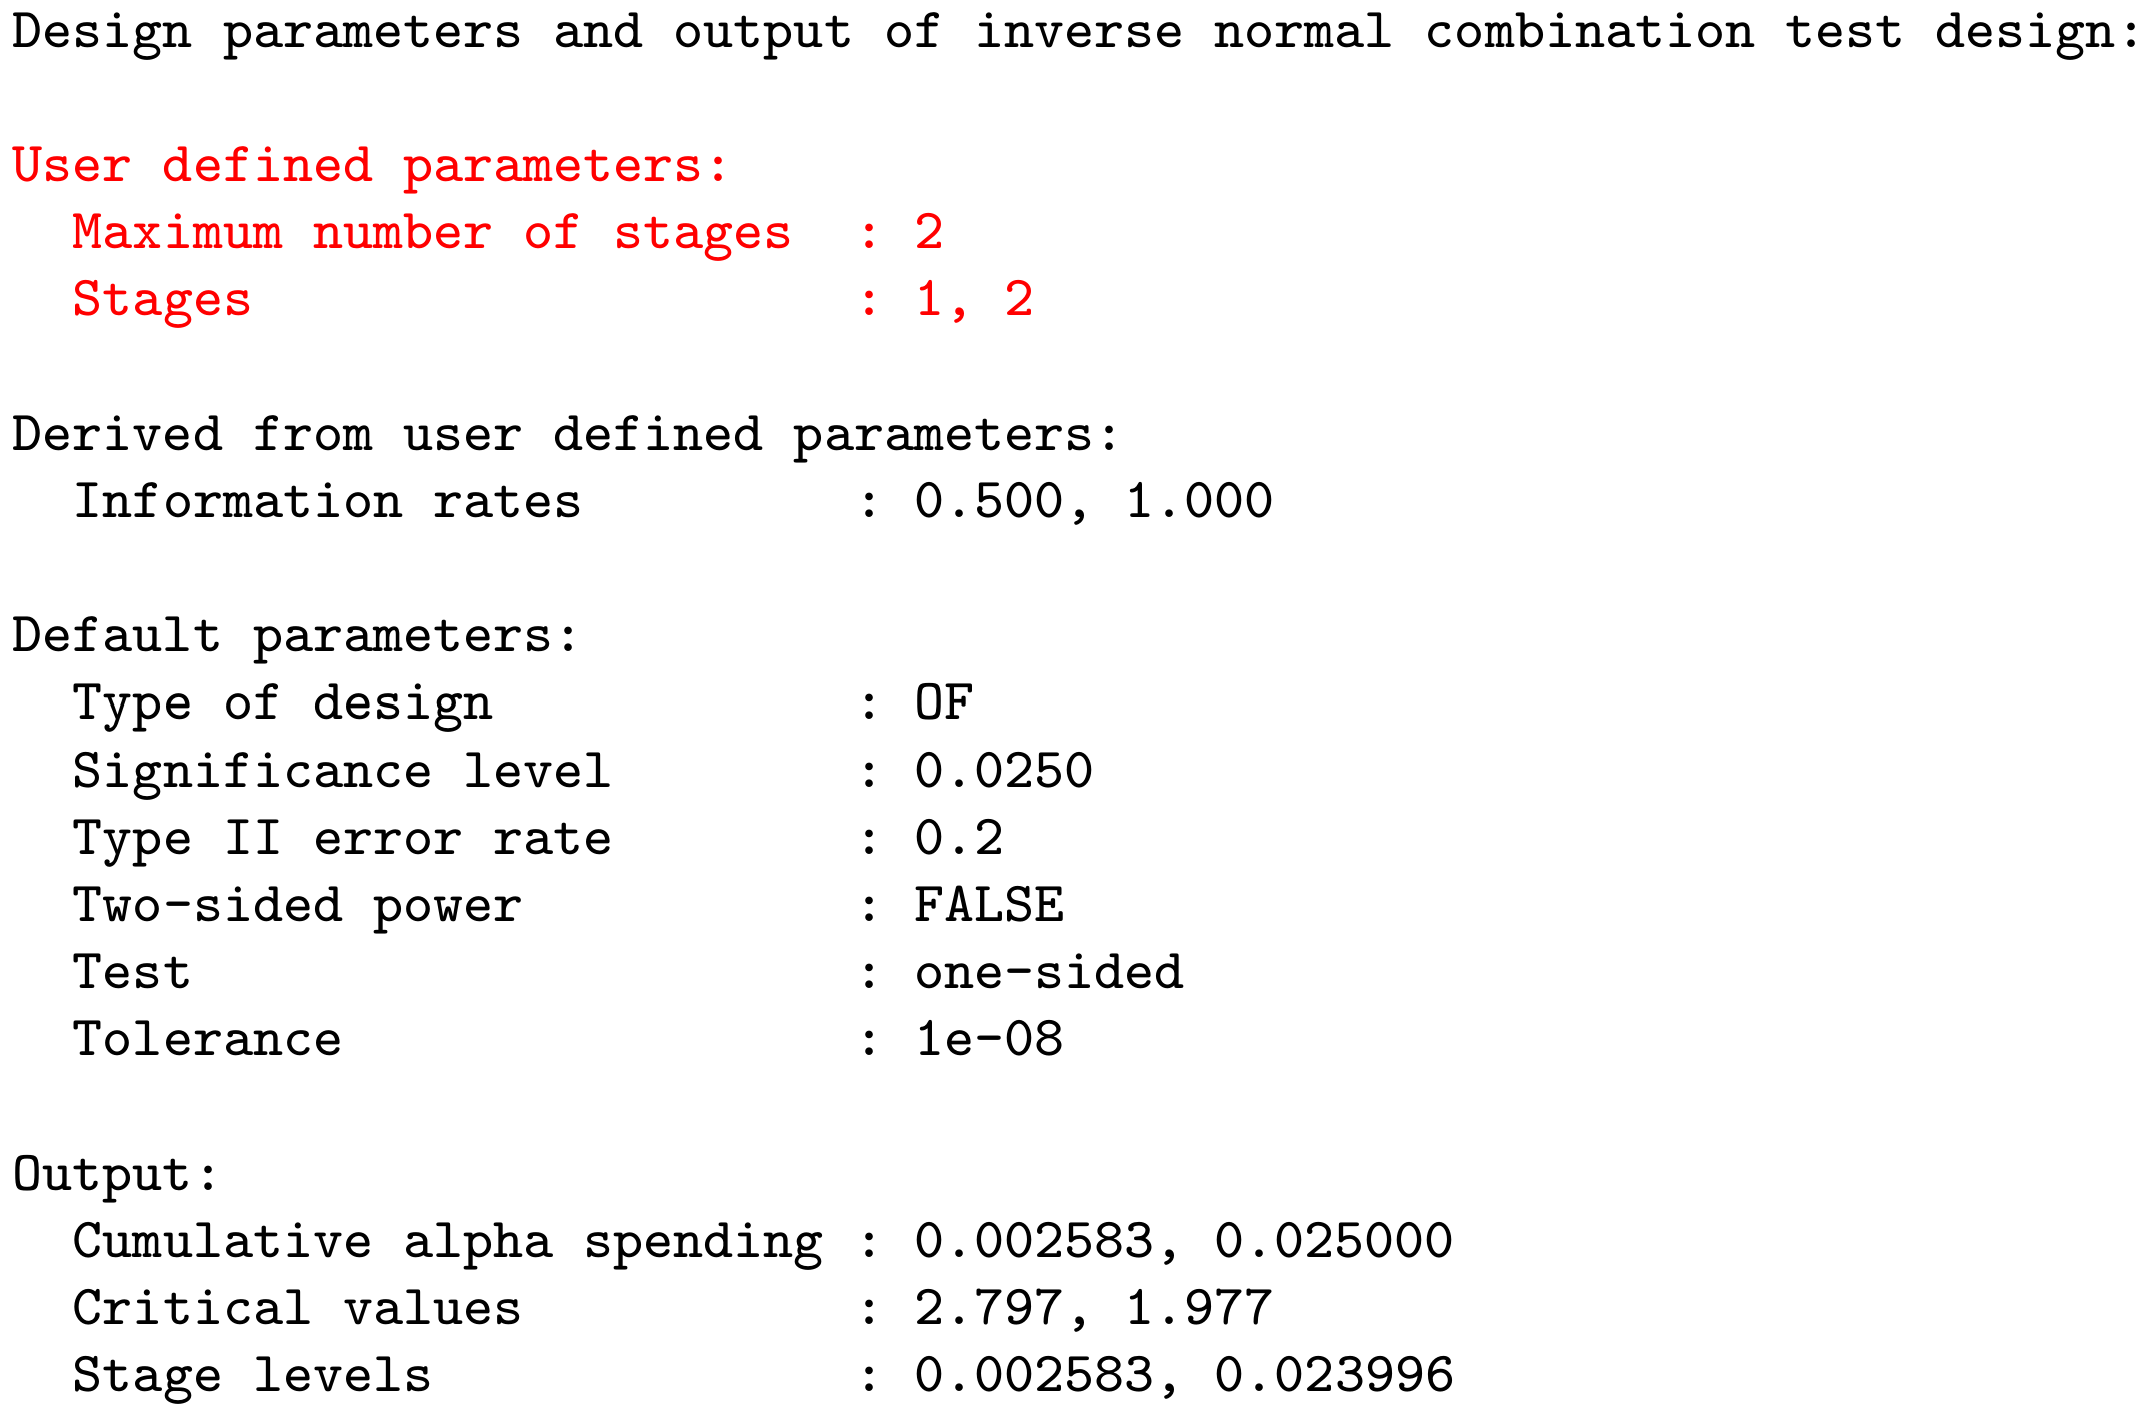
User Concept – Most parameters have a default value
Example: getDesignInverseNormal(kMax = 2) produces the output:
RPACT Connect
- All important information and resources about RPACT on one dashboard page
- Customer-specific resources, e.g.,
- training slides,
- annual meeting slides, and
- the rpact validation documentation
- Use RPACT Connect to jump to RPACT Cloud and unlock advanced features
- Sign up: Please use your corporate email address so RPACT Connect can recognize and load your organization specific resources automatically (when an SLA is available)
- RPACT Connect: connect.rpact.com

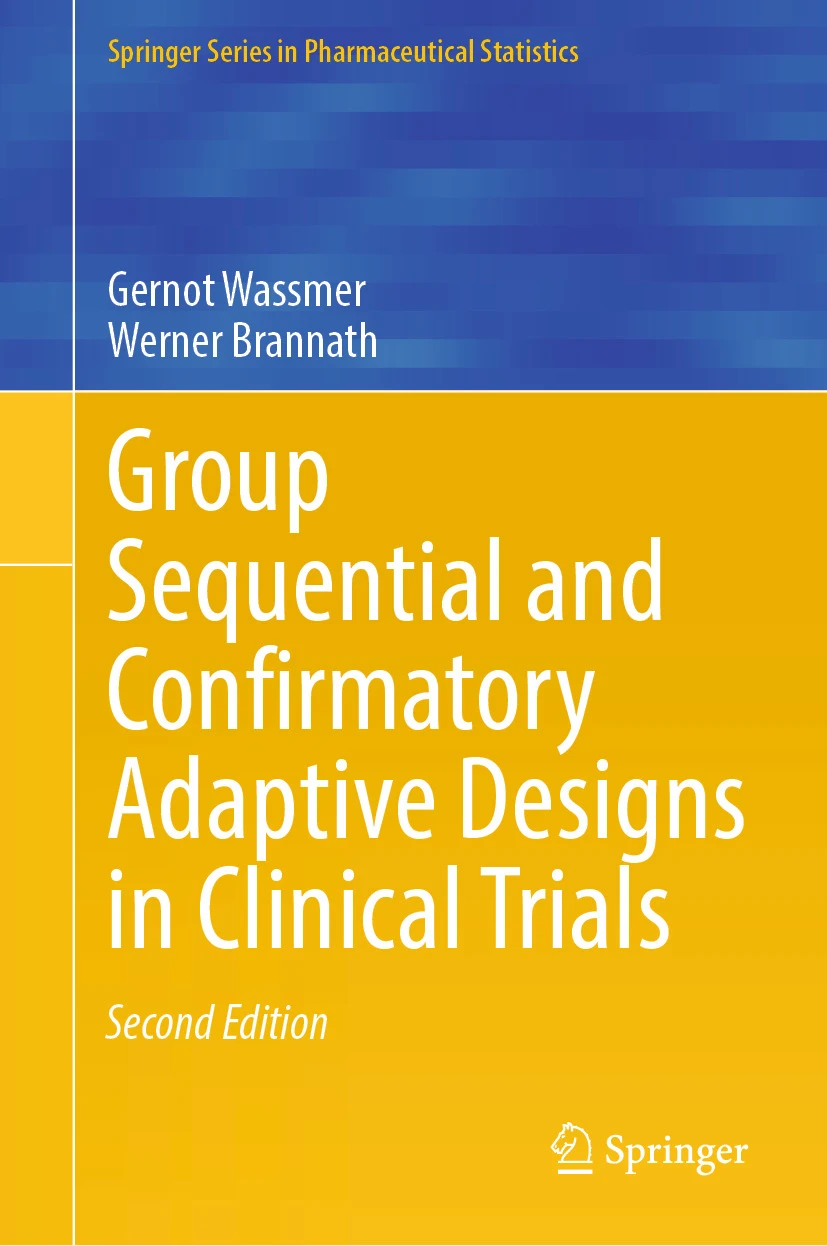
New Edition of the Reference Book
- Group Sequential and Confirmatory Adaptive Designs in Clinical Trials by Gernot Wassmer and Werner Brannath
- Second Edition (Springer, 2025)
- Now featuring numerous
rpactR code examples demonstrating the methods implemented in the package - For more information, visit: link.springer.com/book/10.1007/978-3-031-89669-9
Overview 📦
- Specialized R package for dose escalation trials
- Initial CRAN release in 2016, publication by Sabanés Bové et al. (2019)
- Produces visual and numeric outputs for easy interpretation
- Facilitates simulations to assess the performance under various scenarios
3+3 designs are outdated
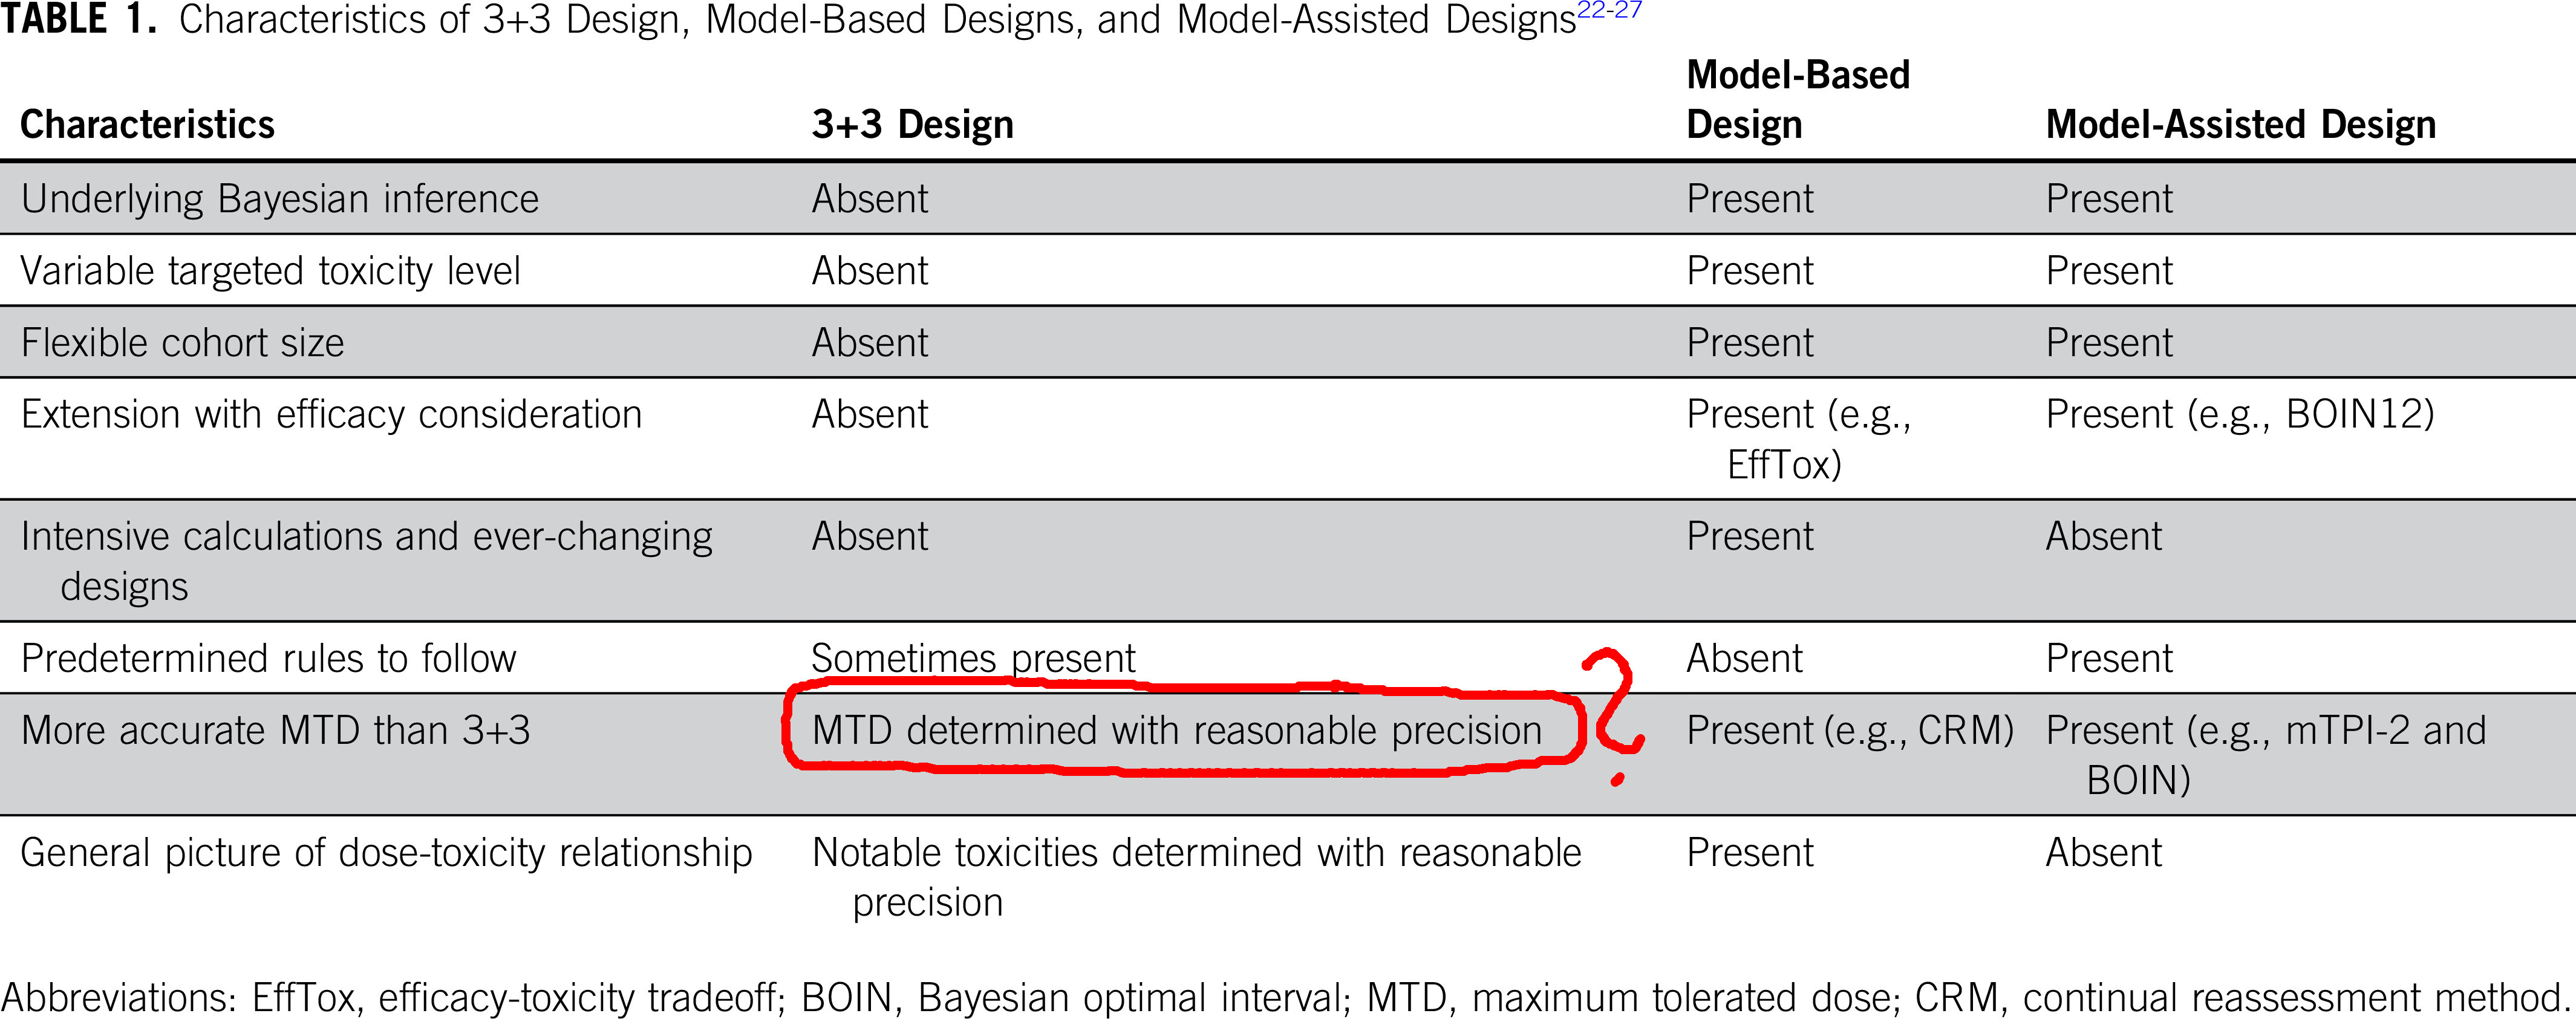
Table taken from “Moving Beyond 3+3: The Future of Clinical Trial Design”
crmPack to the rescue!
With crmPack we aimed to make it easy for everyone to use model-based designs in their dose escalation studies. And indeed, we were successful!
The package provides:
- A flexible framework to define dose escalation designs
- Calculation of operating characteristics via simulations
- Visualization and tabulation of results
- A user-friendly interface to backfill cohorts
- A growing collection of advanced design options (e.g. dual endpoint designs, time-to-event designs, etc.)
![]()
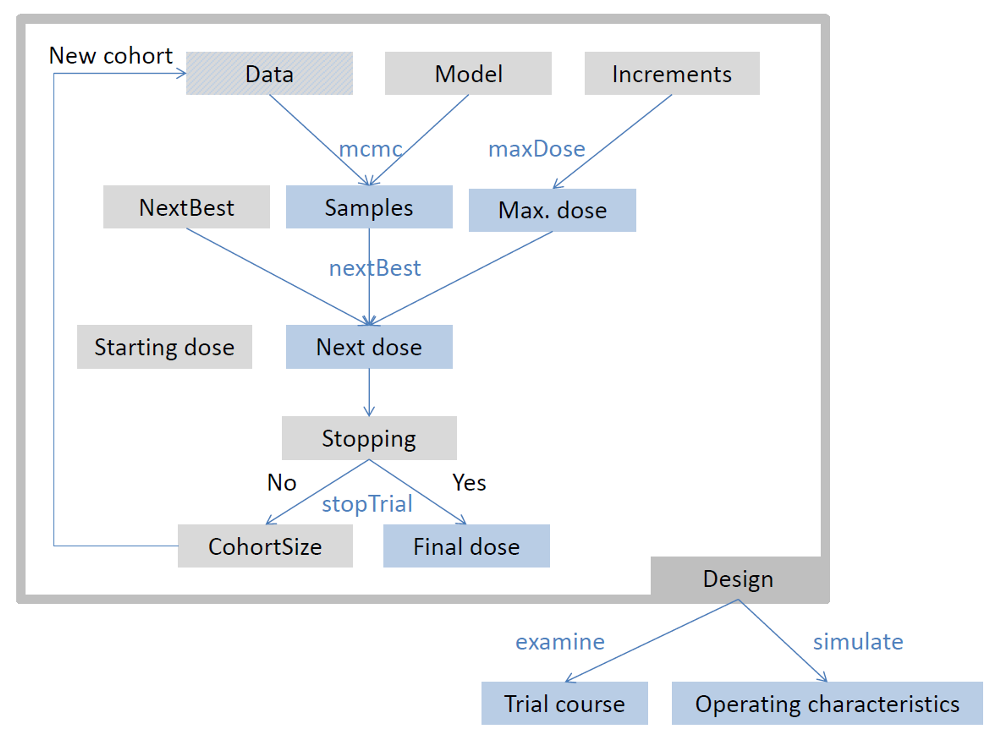
Model-based dose escalation design
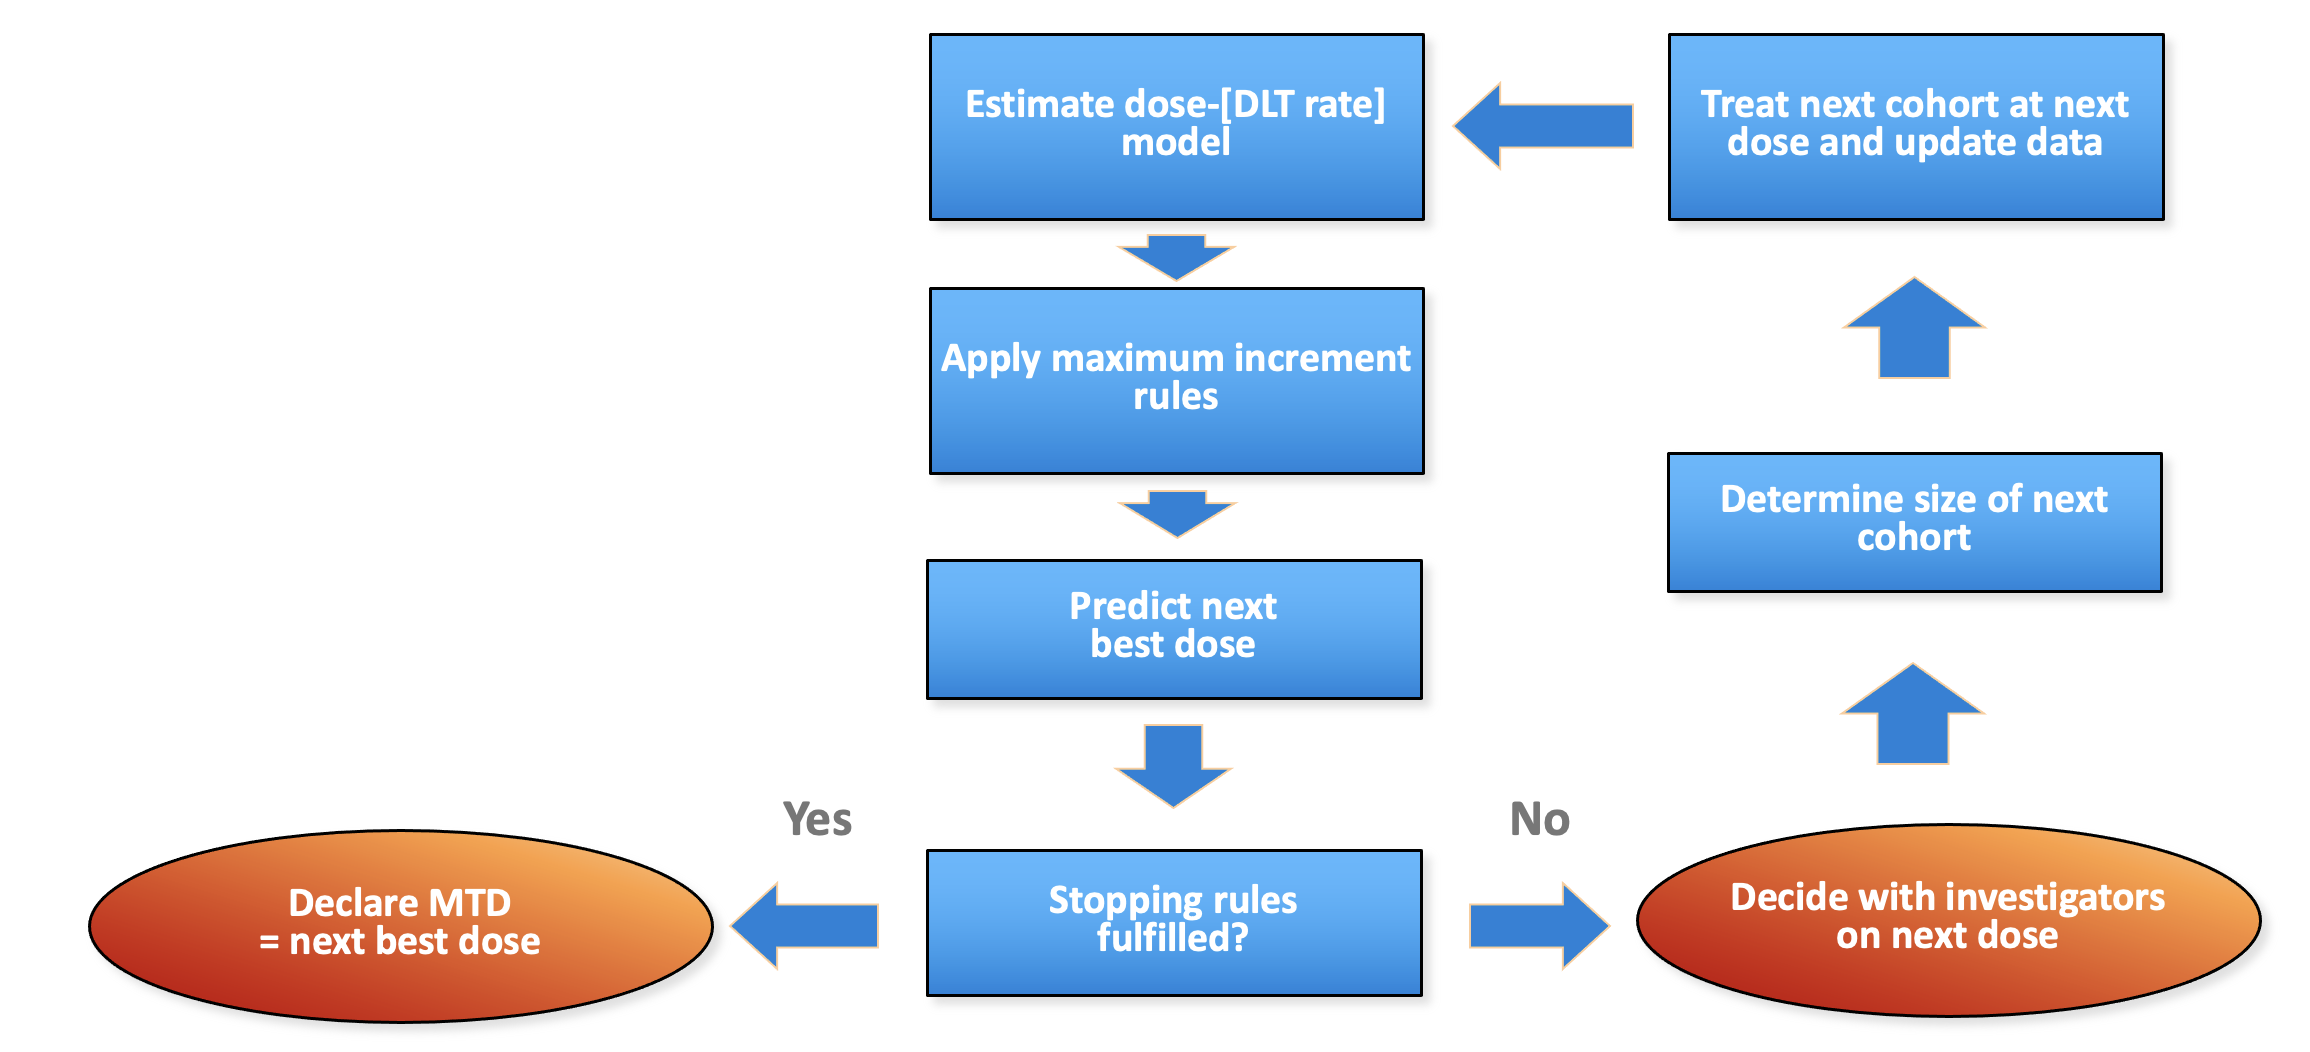
Generic flow chart for model-based dose escalation design
Package structure: parallel to flow
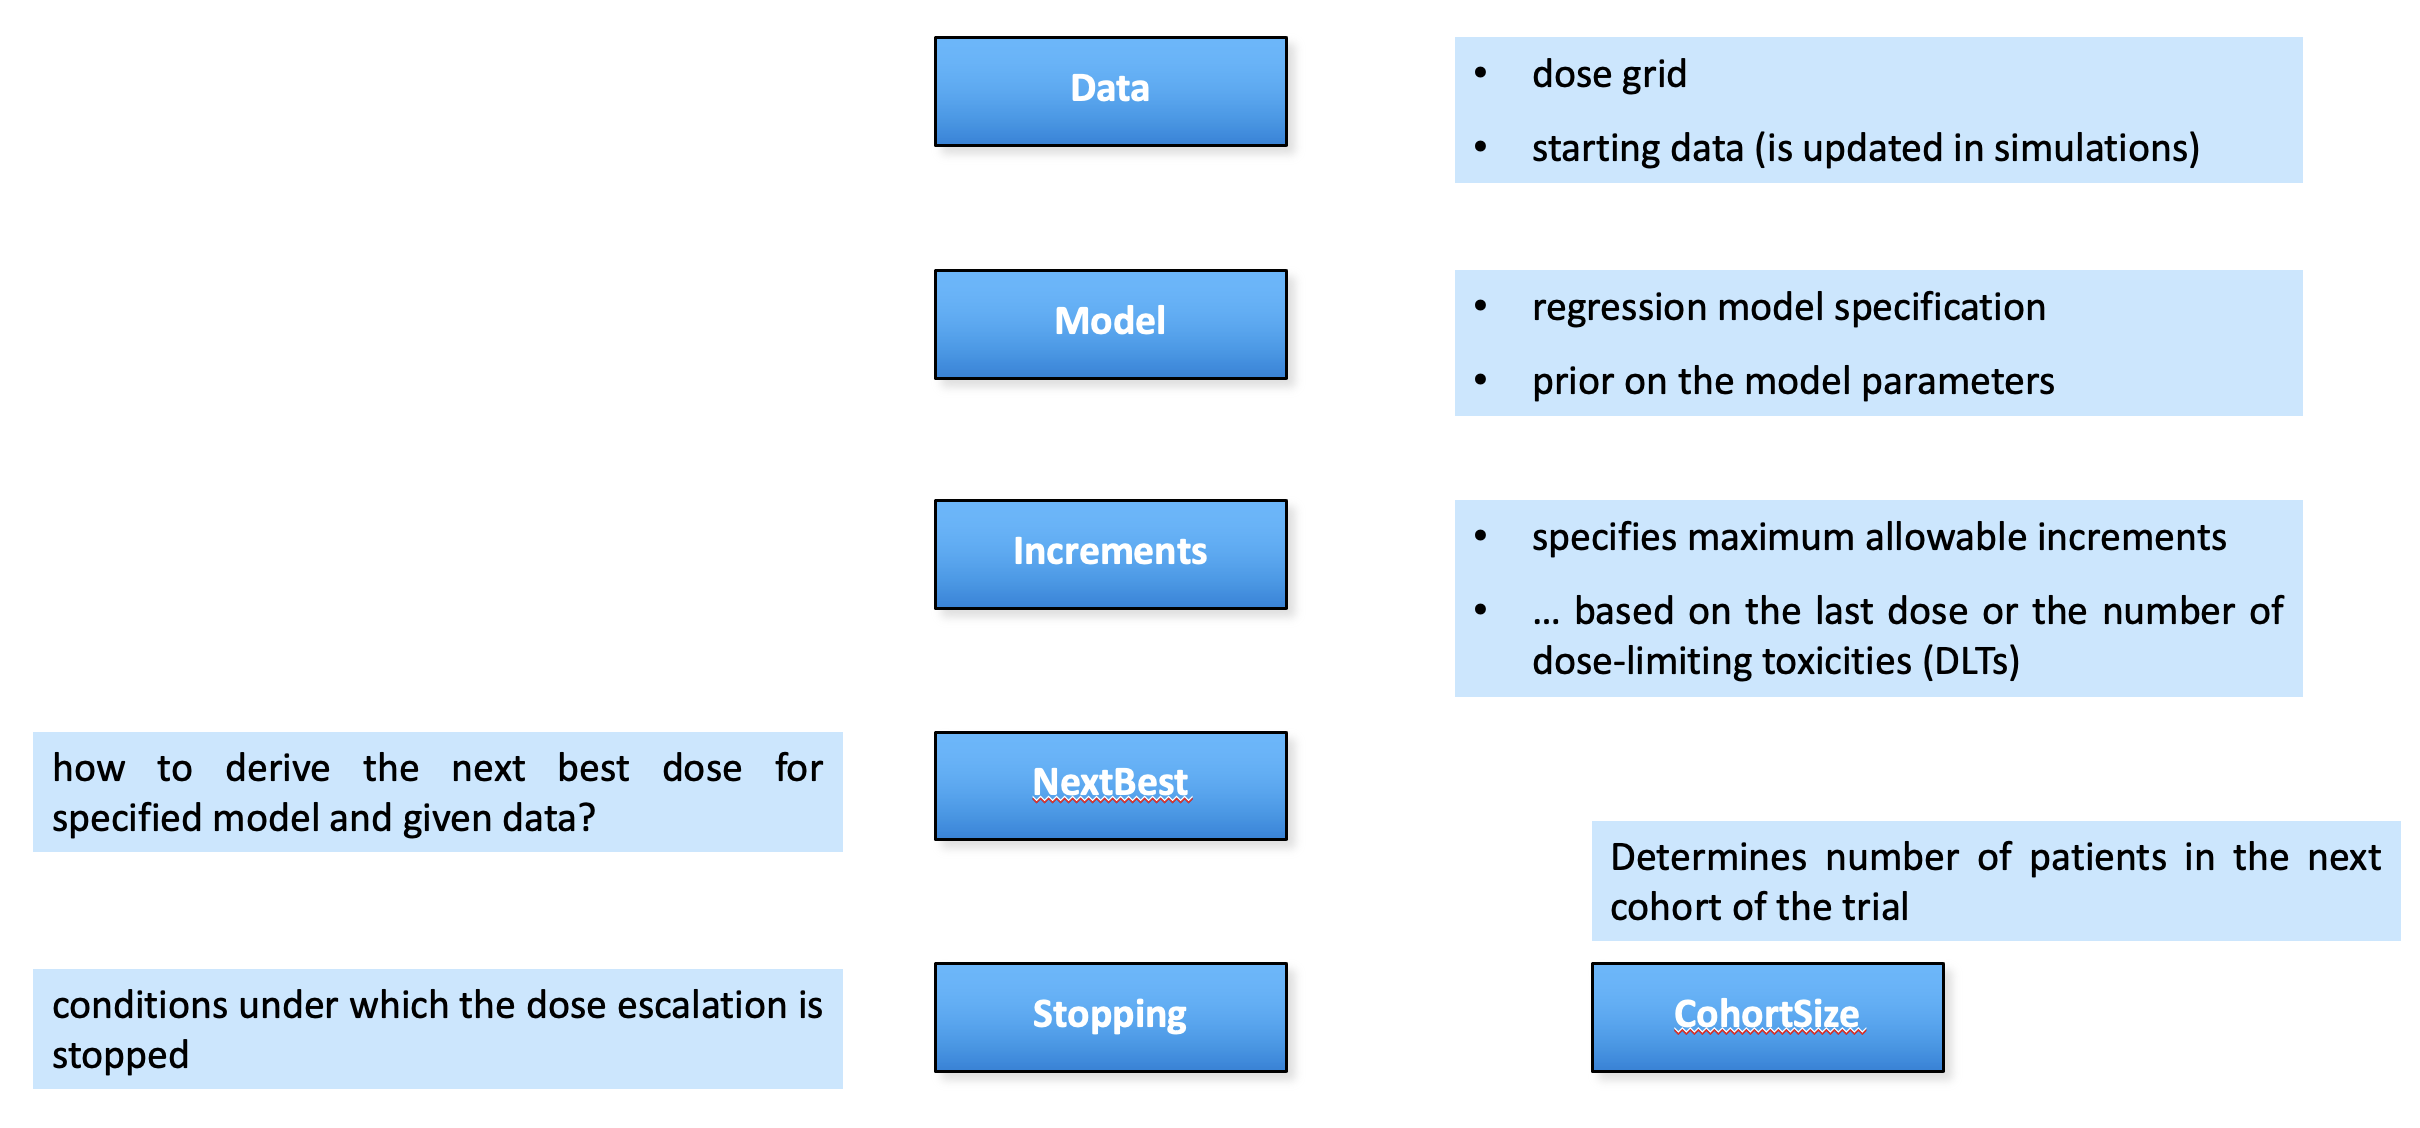
crmPack package structure parallels the flow chart
Framework in crmPack
crmPack package framework
Short Example: Dose Escalation Design 💊
# install.packages(crmPack)
library(crmPack)

empty_data <- Data(doseGrid = c(1, 3, seq(from = 5, to = 100, by = 5)))

# Initialize the CRM model.
my_model <- LogisticLogNormal(
    mean = c(-4, 0.5),
    cov = matrix(c(8, -2, -2, 2), nrow = 2),
    ref_dose = 50
)

# Get prior samples and plot.
mcmc_opts <- McmcOptions()
prior_samples <- mcmc(empty_data, my_model, mcmc_opts)
plot(prior_samples, my_model, empty_data)
# Choose the rule for selecting the next dose.
my_next_best <- NextBestNCRM(
target = c(0.2, 0.35),
overdose = c(0.35, 1),
max_overdose_prob = 0.25
)
# Choose the rule for the cohort-size.
my_size <- CohortSizeConst(3)
# Choose the rule for stopping.
my_stopping1 <- StoppingMinCohorts(nCohorts = 3)
my_stopping2 <- StoppingTargetProb(
target = c(0.2, 0.35),
prob = 0.5
)
my_stopping3 <- StoppingMinPatients(nPatients = 20)
my_stopping <- (my_stopping1 & my_stopping2) | my_stopping3
# Choose the rule for dose increments.
my_increments <- IncrementsRelative(
intervals = c(0, 20),
increments = c(1, 0.5)
)
# Initialize the design.
design <- Design(
model = my_model,
nextBest = my_next_best,
stopping = my_stopping,
increments = my_increments,
cohort_size = my_size,
data = empty_data,
startingDose = 3
)
# Examine possible outcomes.
examine(design) dose DLTs nextDose stop increment
1 3 0 5 FALSE 67
2 3 1 3 FALSE 0
3 3 2 NA FALSE NA
4 3 3 NA FALSE NA
5 5 0 10 FALSE 100
6 5 1 10 FALSE 100
7 5 2 1 FALSE -80
8 5 3 NA FALSE NA
9 10 0 20 FALSE 100
10 10 1 20 FALSE 100
11 10 2 10 FALSE 0
12 10 3 3 FALSE -70
13 20 0 30 FALSE 50
14 20 1 30 FALSE 50
15 20 2 20 FALSE 0
16 20 3 10 FALSE -50
17 30 0 45 FALSE 50
18 30 1 45 FALSE 50
19 30 2 30 FALSE 0
20 30 3 20 FALSE -33
21 45 0 65 FALSE 44
22 45 1 65 FALSE 44
23 45 2 45 FALSE 0
24 45 3 35 FALSE -22
25 65 0 95 TRUE 46
26 65 1 65 TRUE 0
27 65 2 55 TRUE -15
28 65 3 50 TRUE -23# Simulate under different scenarios.
myTruth <- probFunction(my_model, alpha0 = 7, alpha1 = 8)
my_sims <- simulate(design, truth = myTruth, nsim = 10)
summary(my_sims, truth = myTruth)Summary of 10 simulations
Target toxicity interval was 20, 35 %
Target dose interval corresponding to this was 17.5, 19.3
Intervals are corresponding to 10 and 90 % quantiles
Number of patients overall : mean 21 (21, 21)
Number of patients treated above target tox interval : mean 8 (6, 12)
Proportions of DLTs in the trials : mean 23 % (19 %, 29 %)
Mean toxicity risks for the patients on active : mean 22 % (12 %, 32 %)
Doses selected as MTD : mean 16.5 (14.5, 20.5)
True toxicity at doses selected : mean 21 % (6 %, 46 %)
Proportion of trials selecting target MTD: 0 %
Dose most often selected as MTD: 15
Observed toxicity rate at dose most often selected: 11 %
Fitted toxicity rate at dose most often selected : mean 21 % (19 %, 26 %)
Stop reason triggered:
≥ 3 cohorts dosed : 100 %
P(0.2 ≤ prob(DLE | NBD) ≤ 0.35) ≥ 0.5 : 10 %
≥ 20 patients dosed : 100 %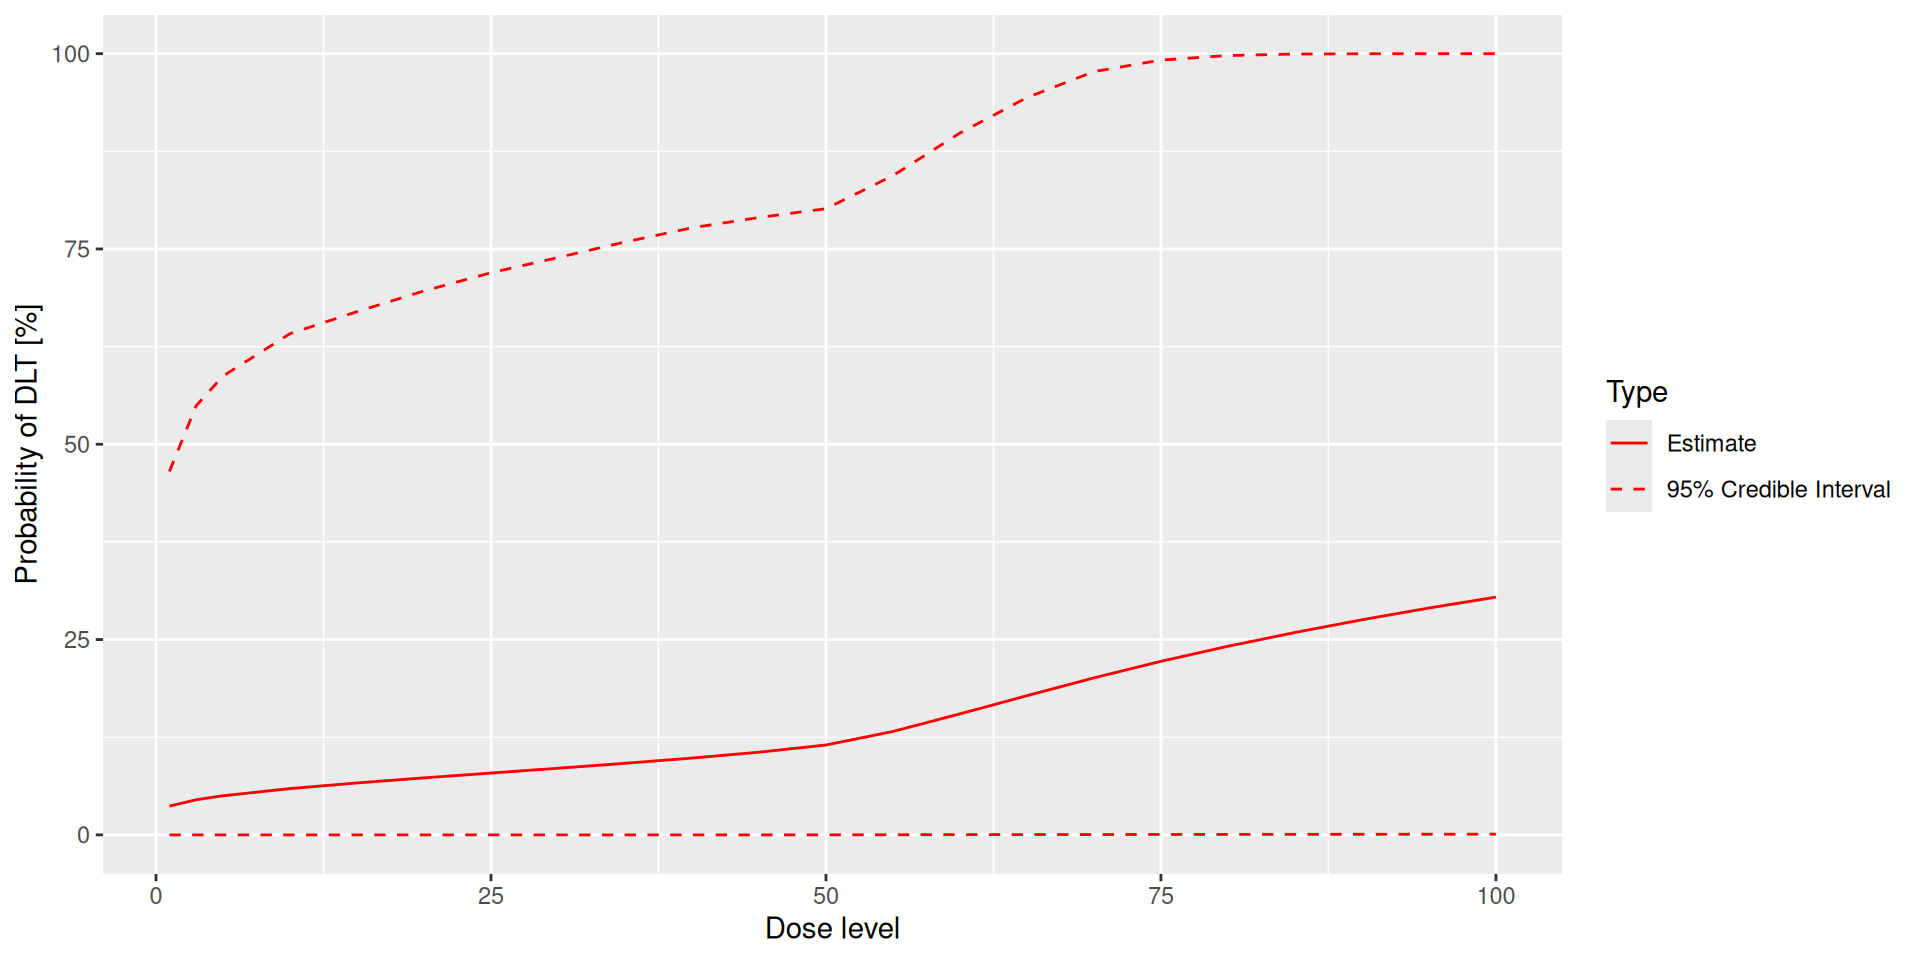
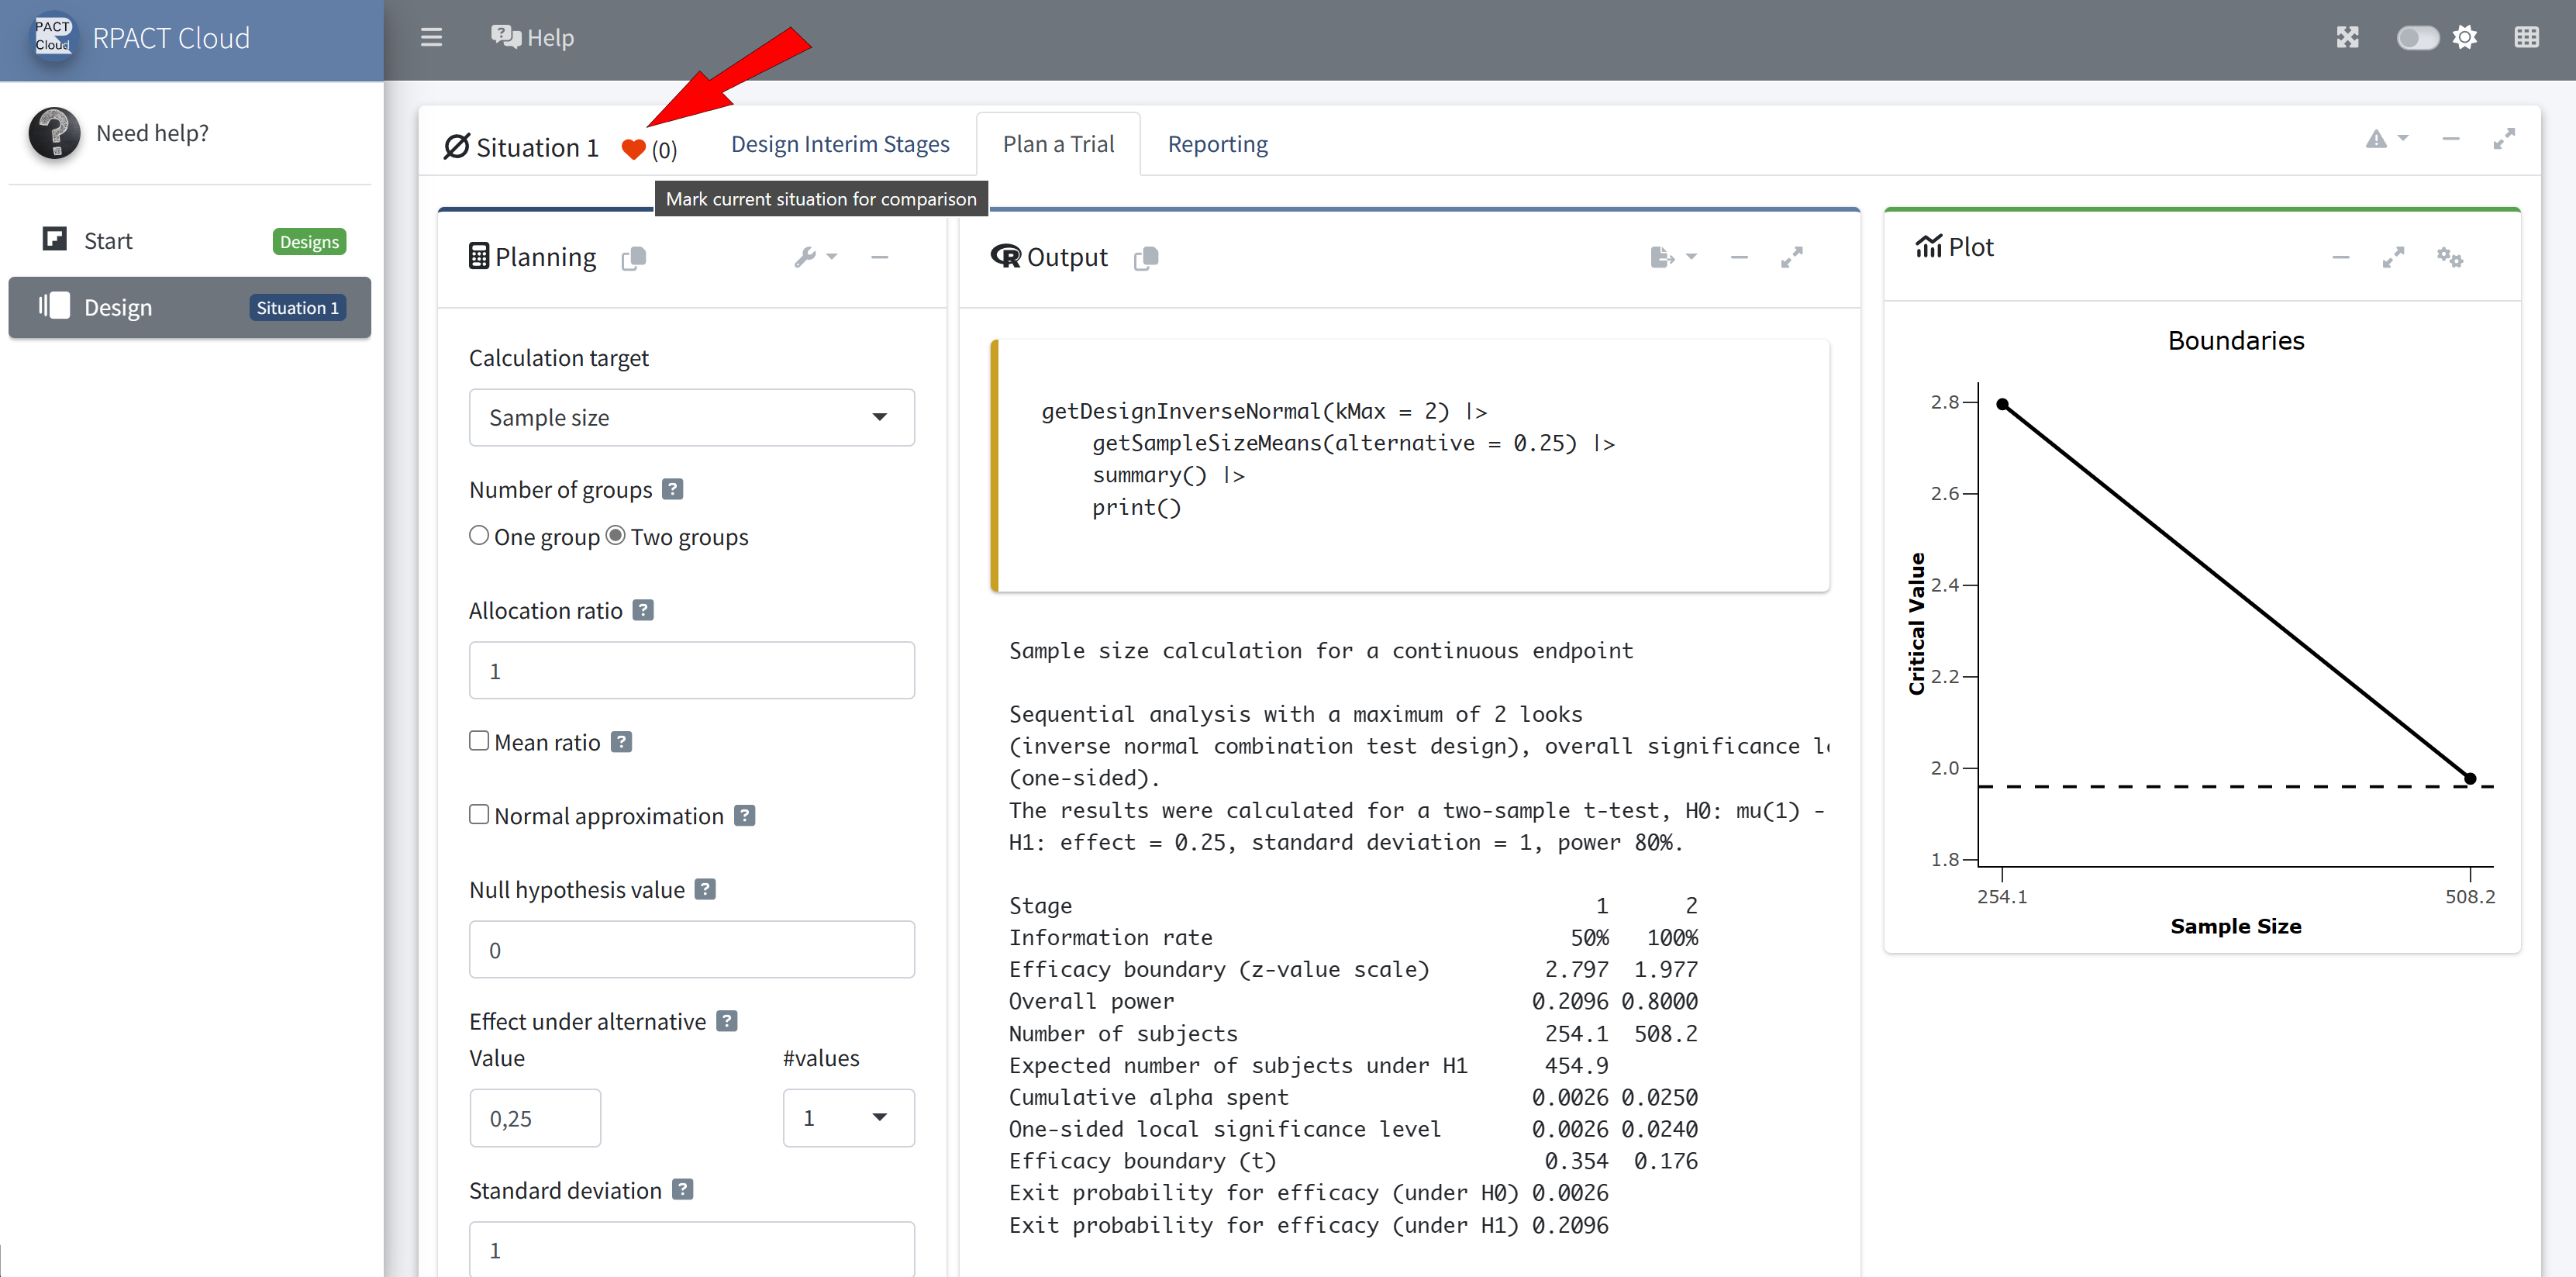
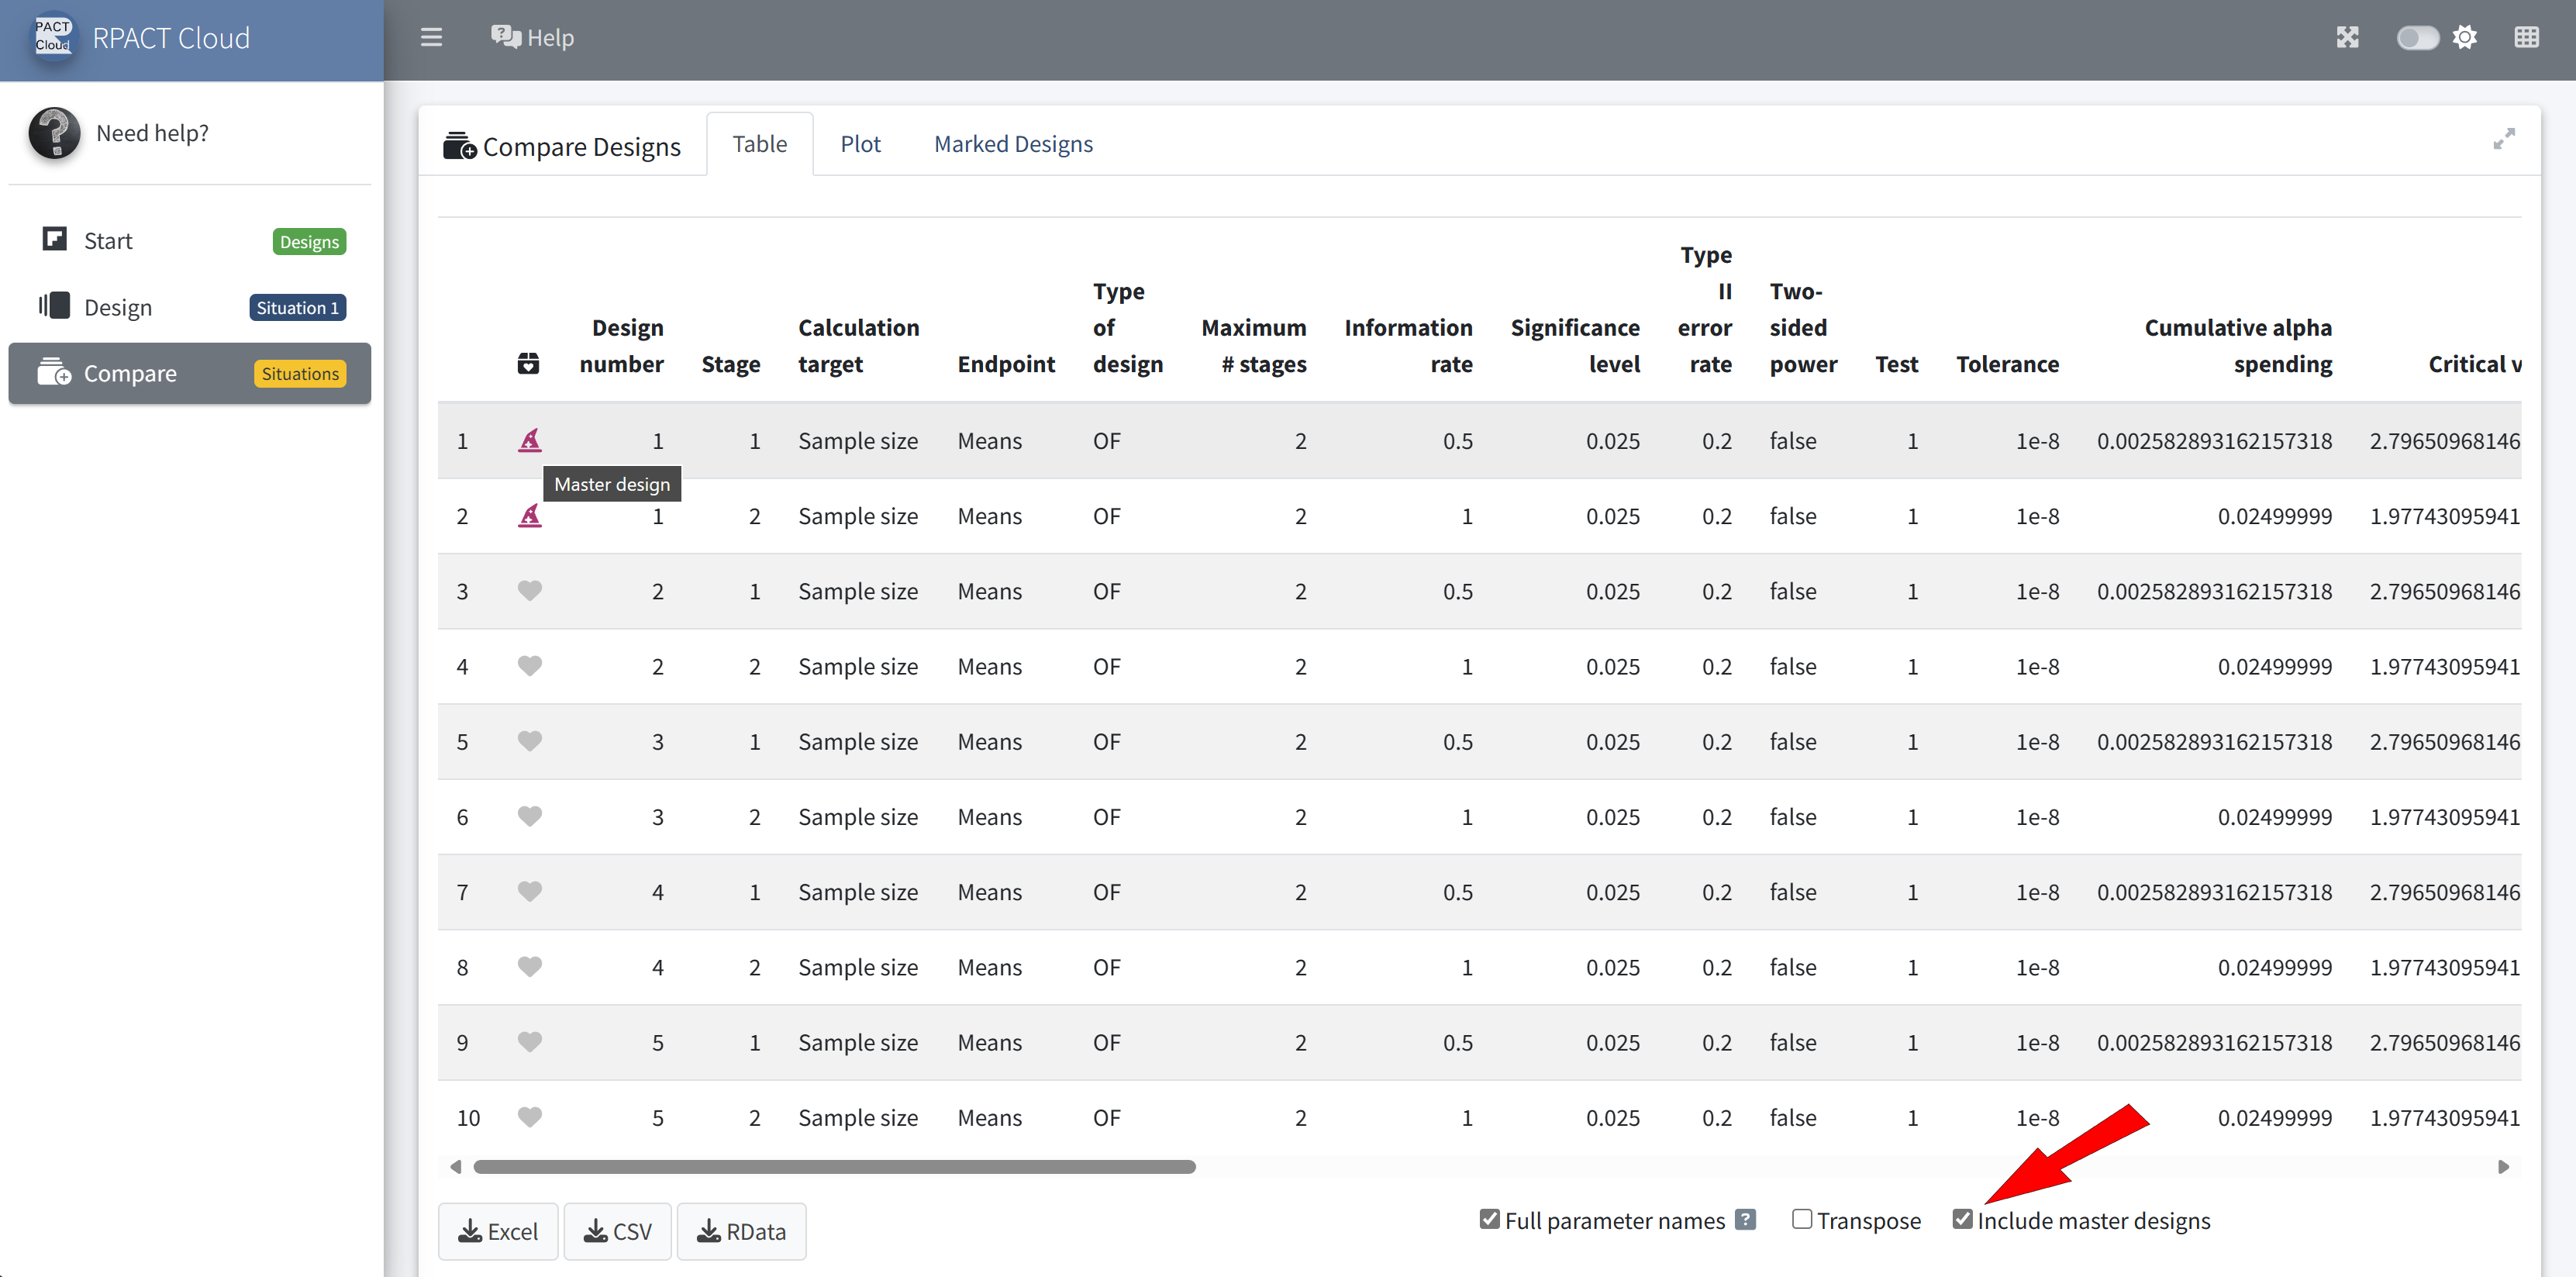
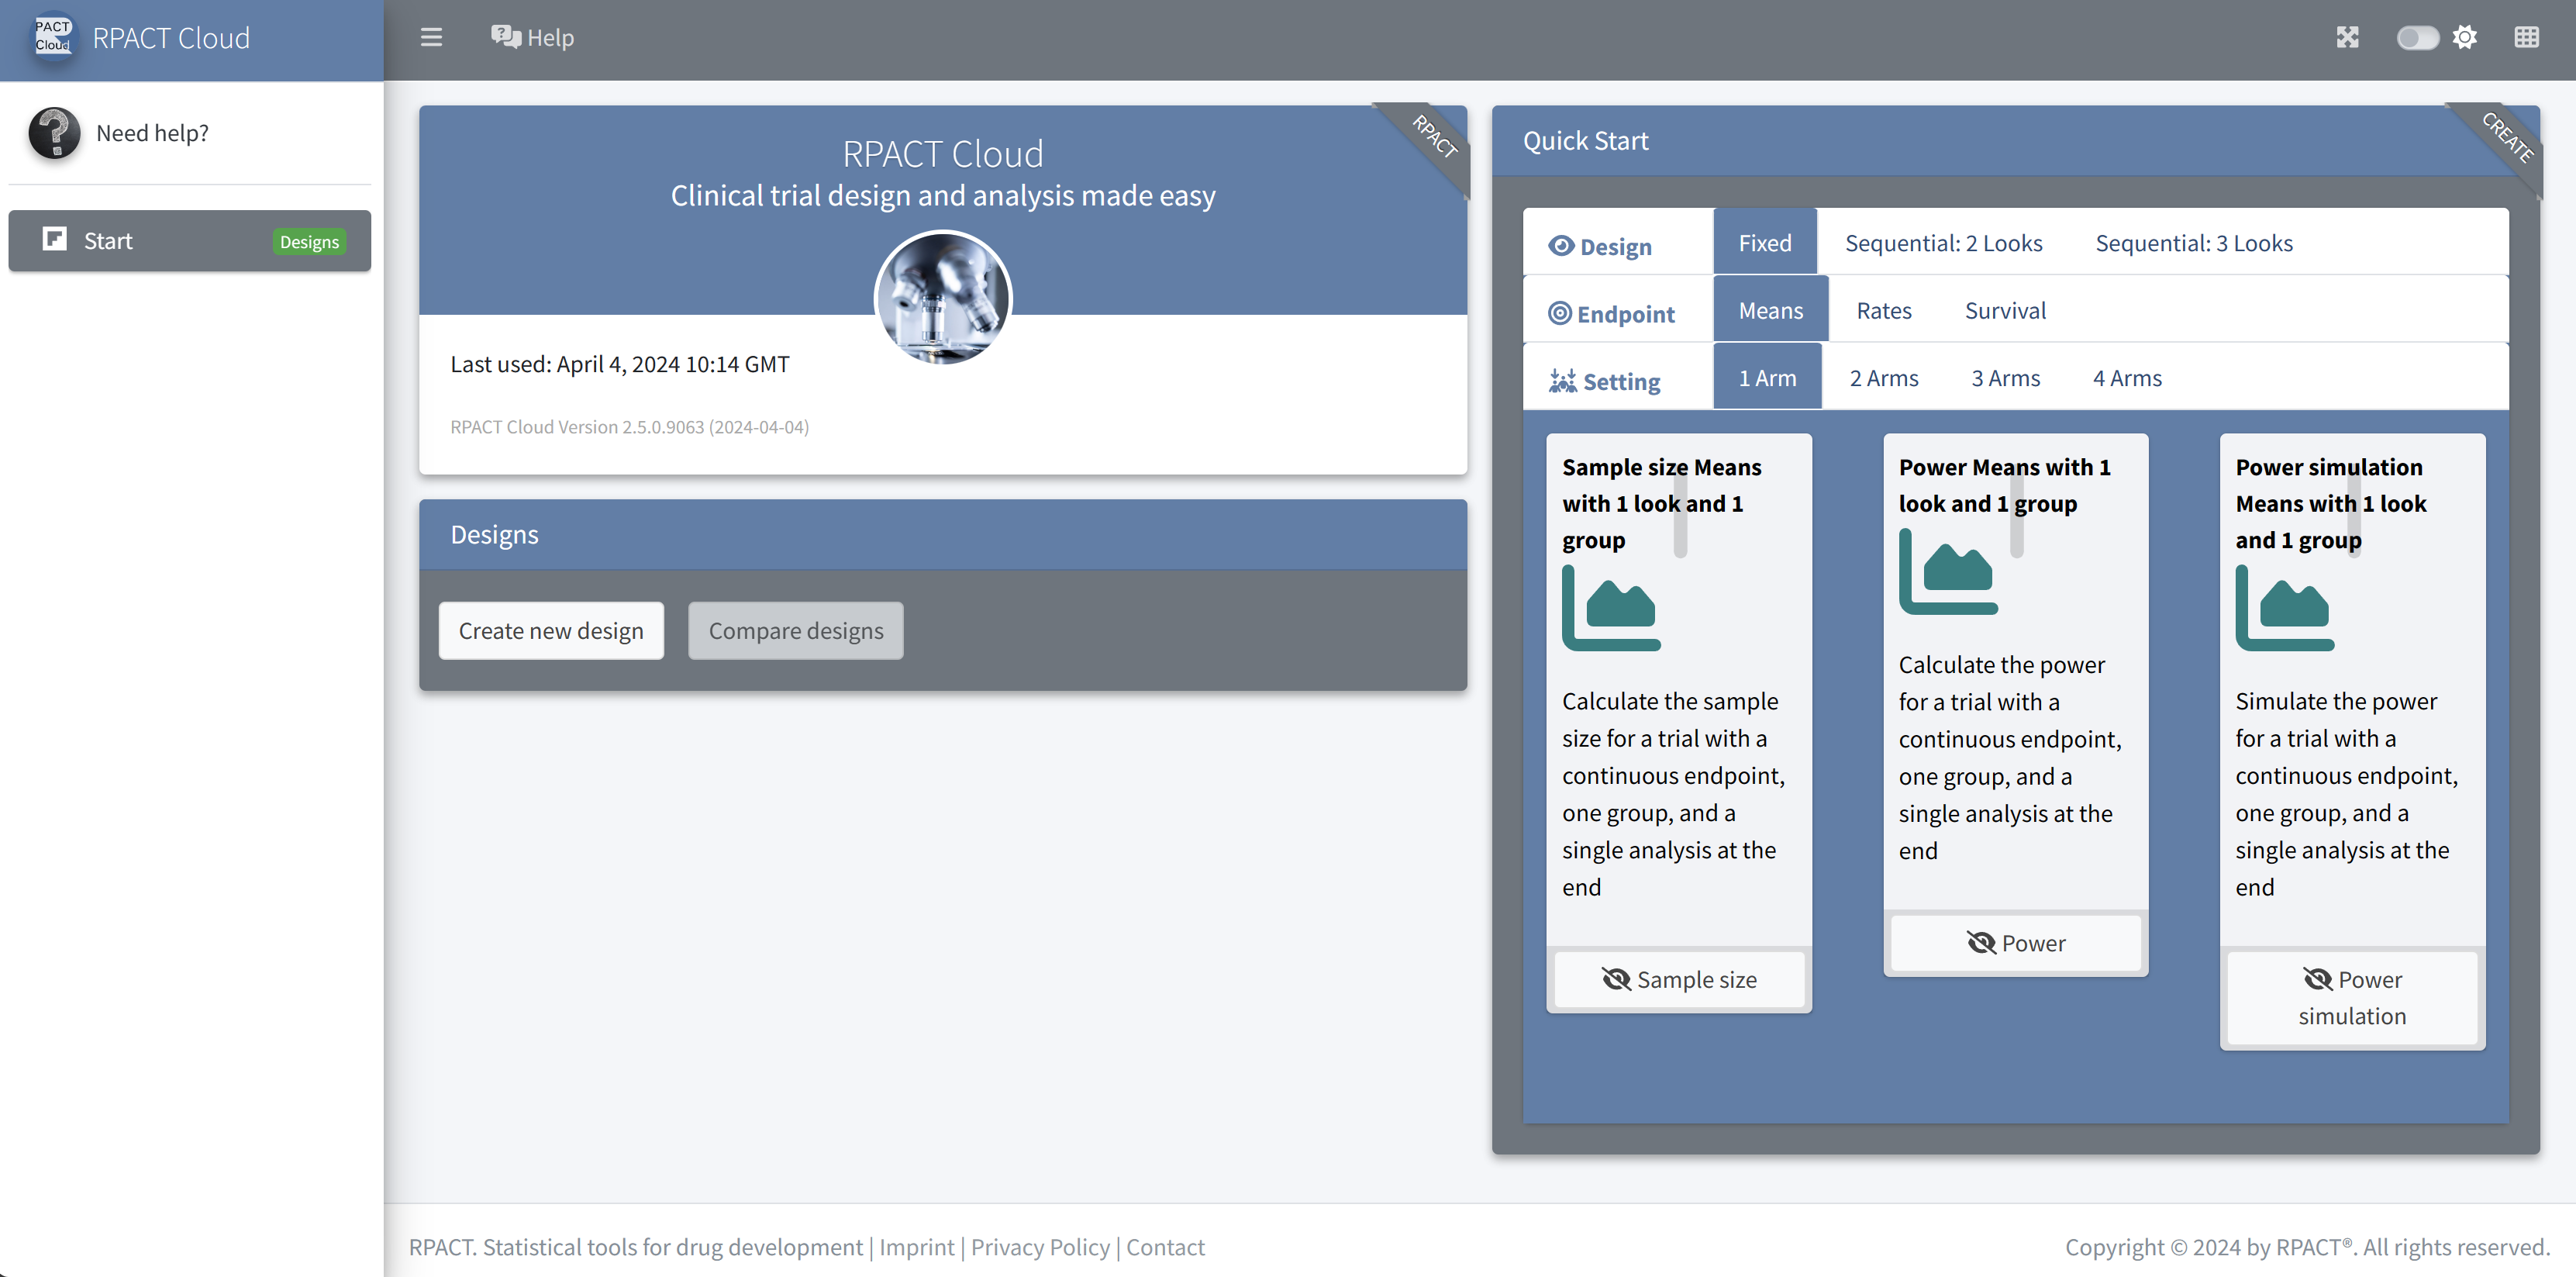
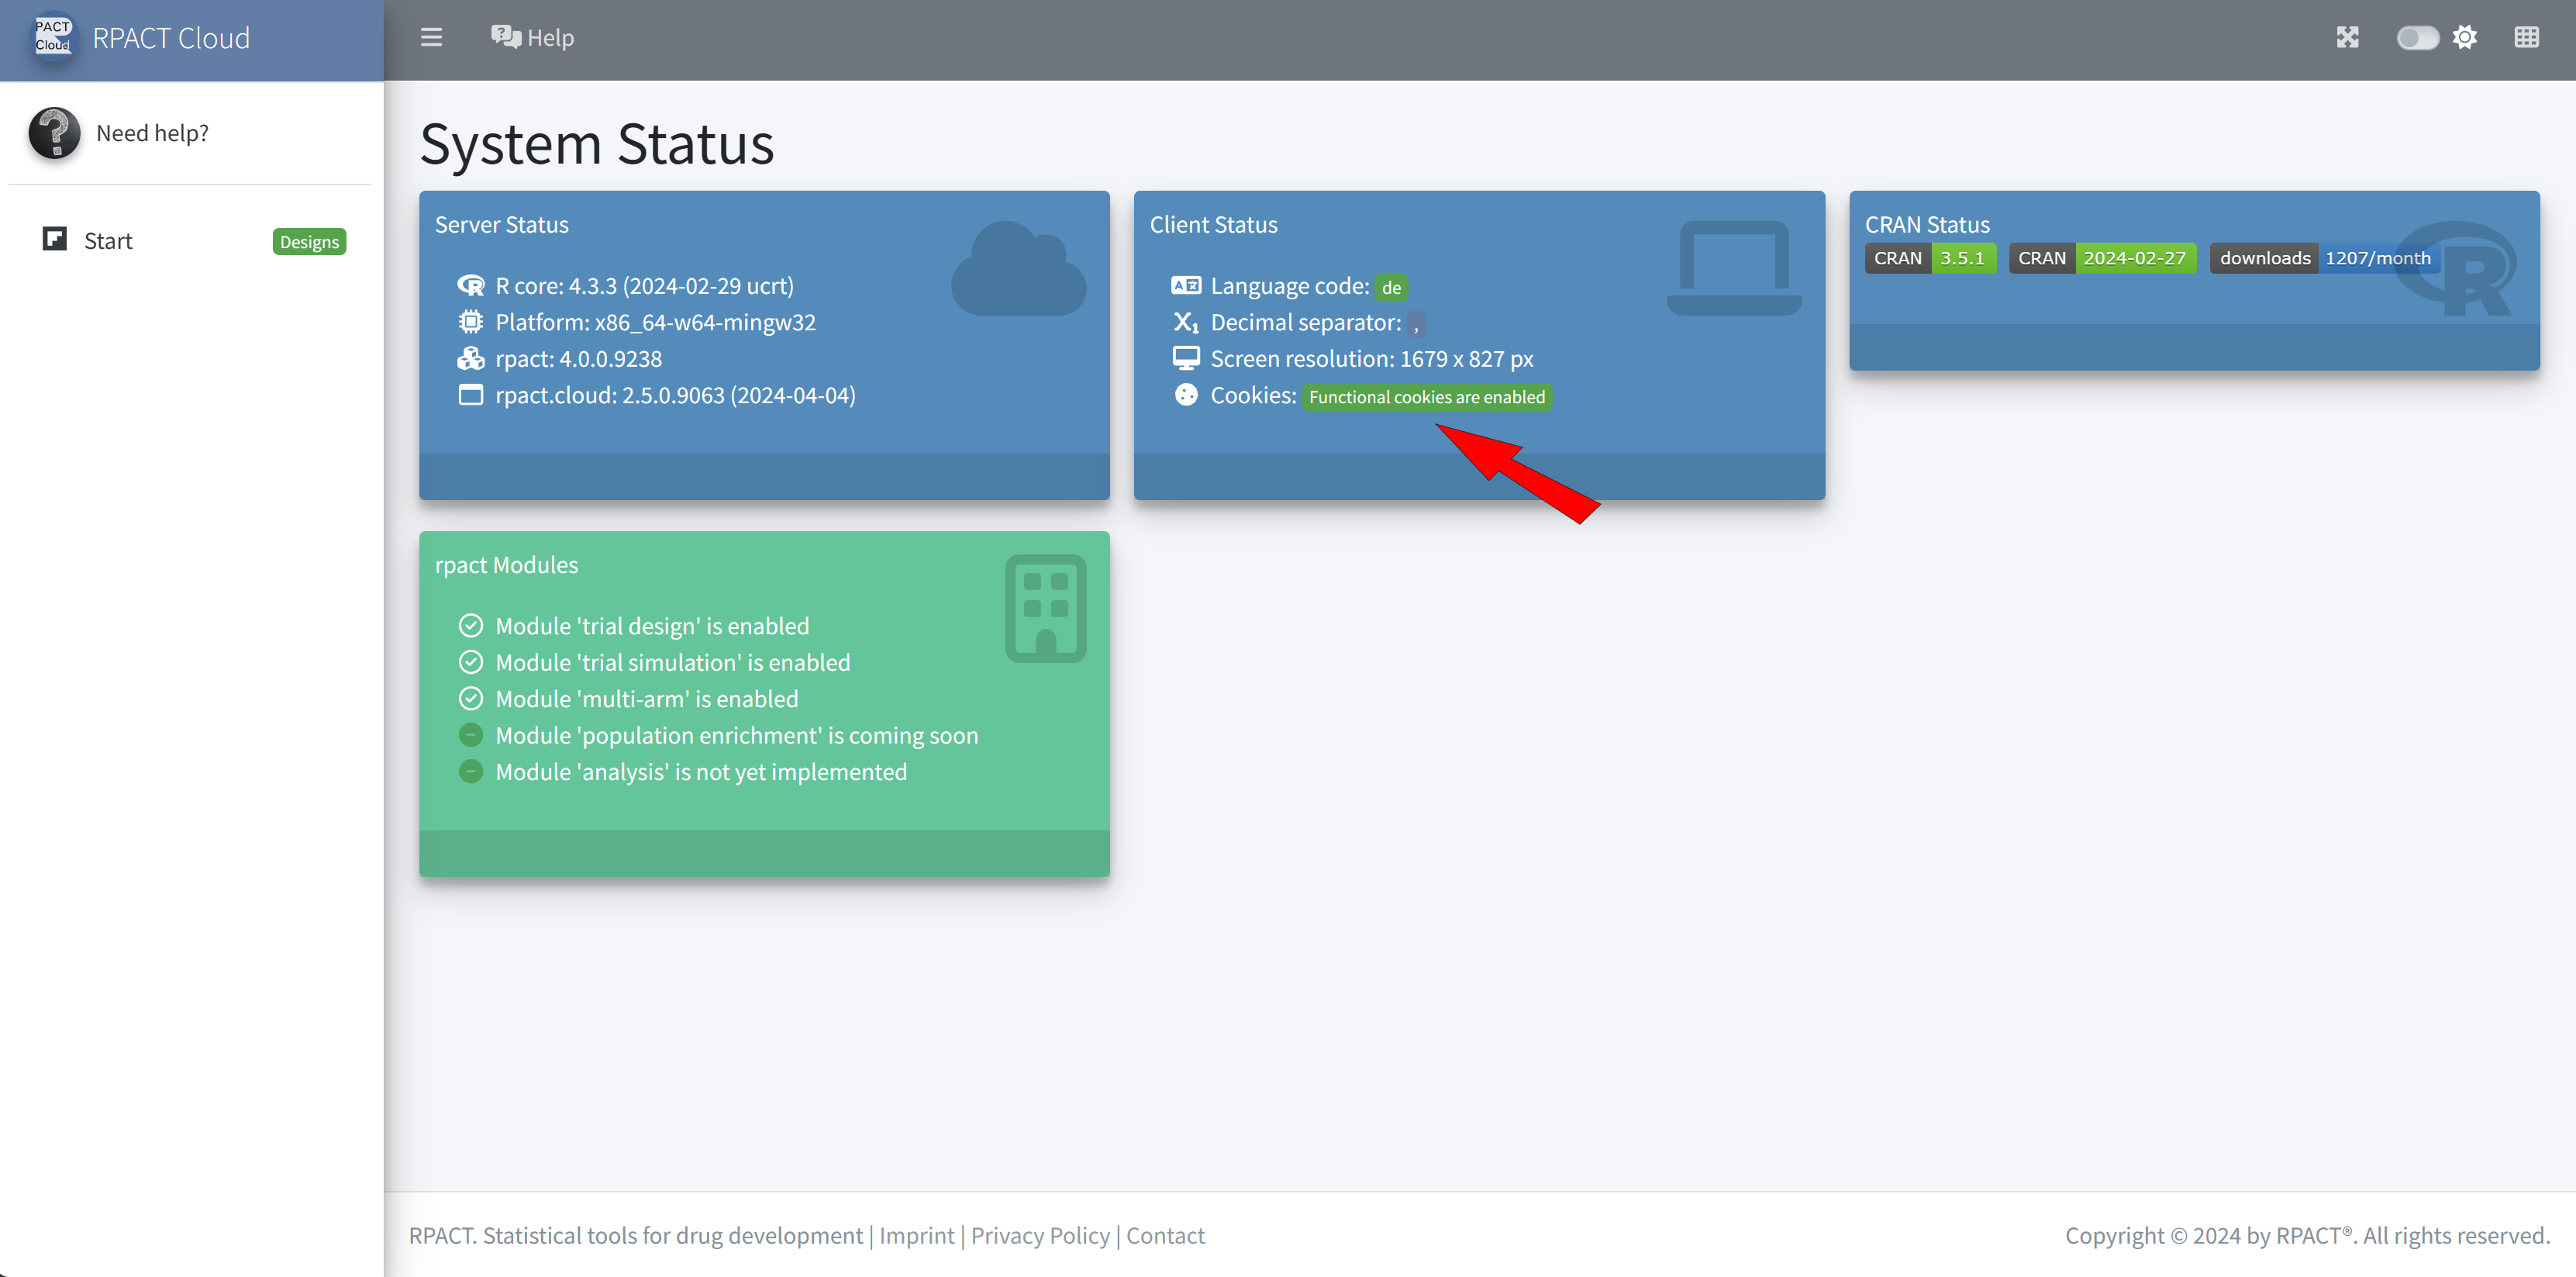
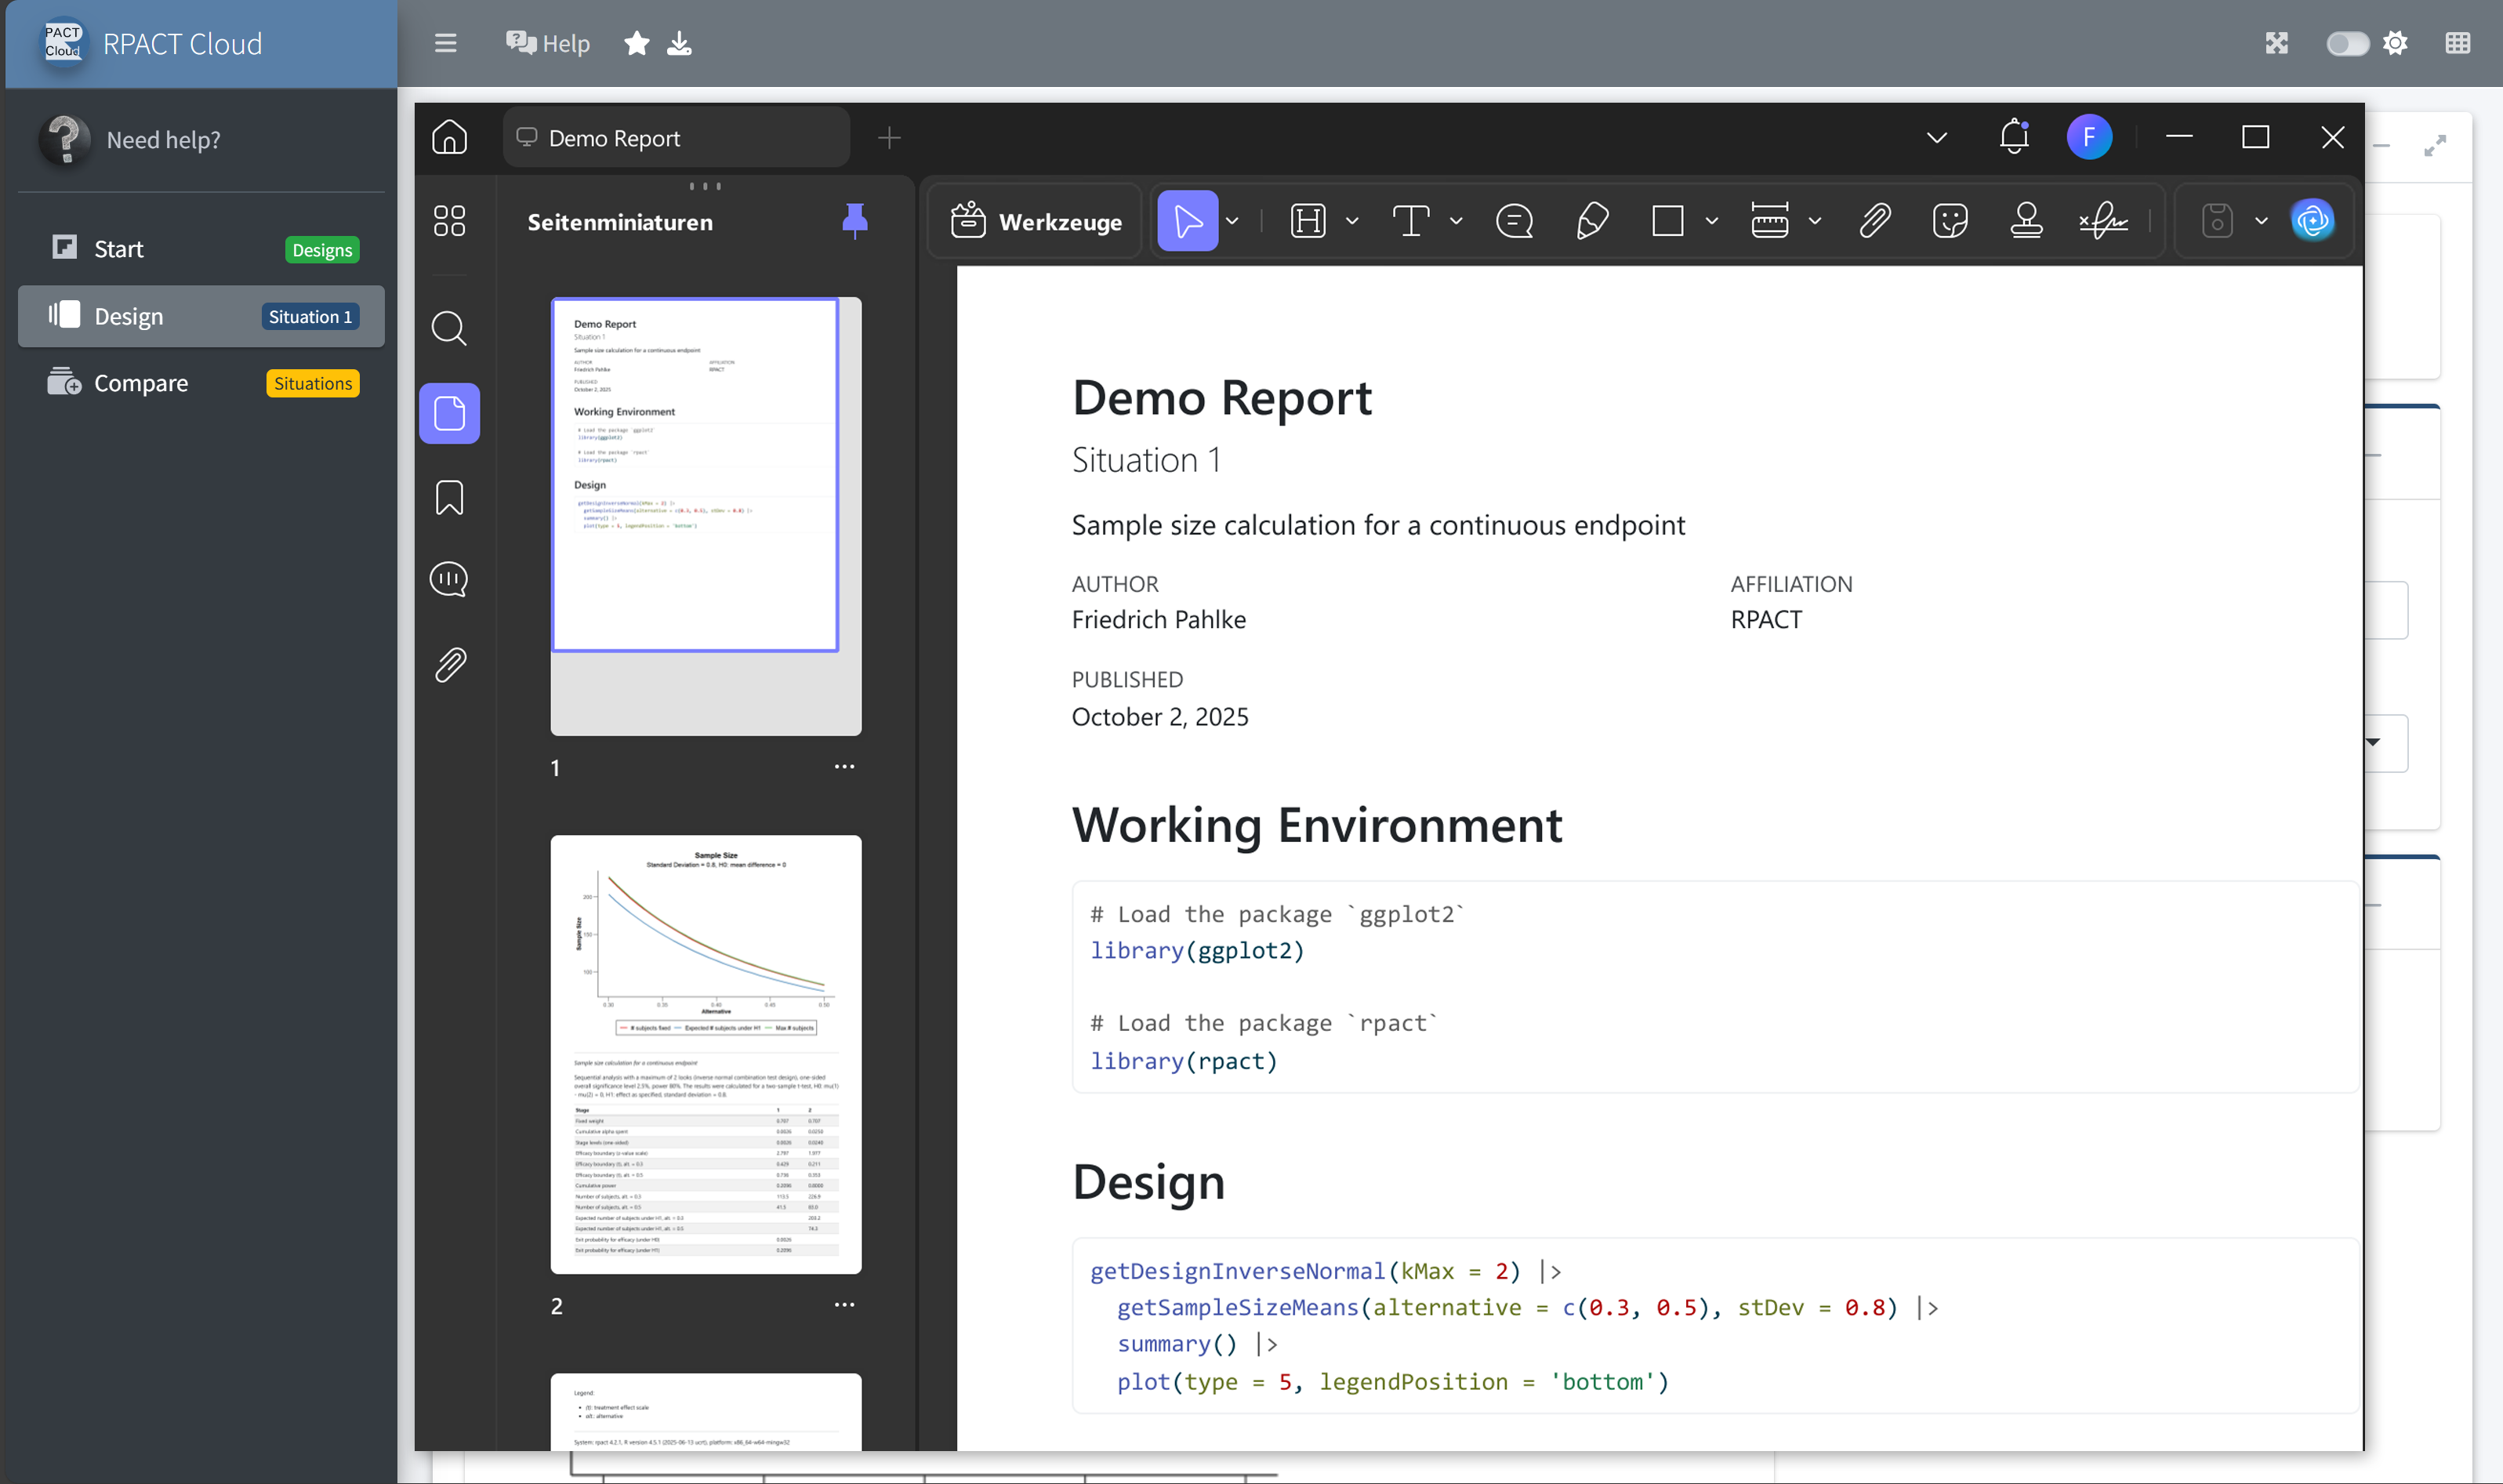
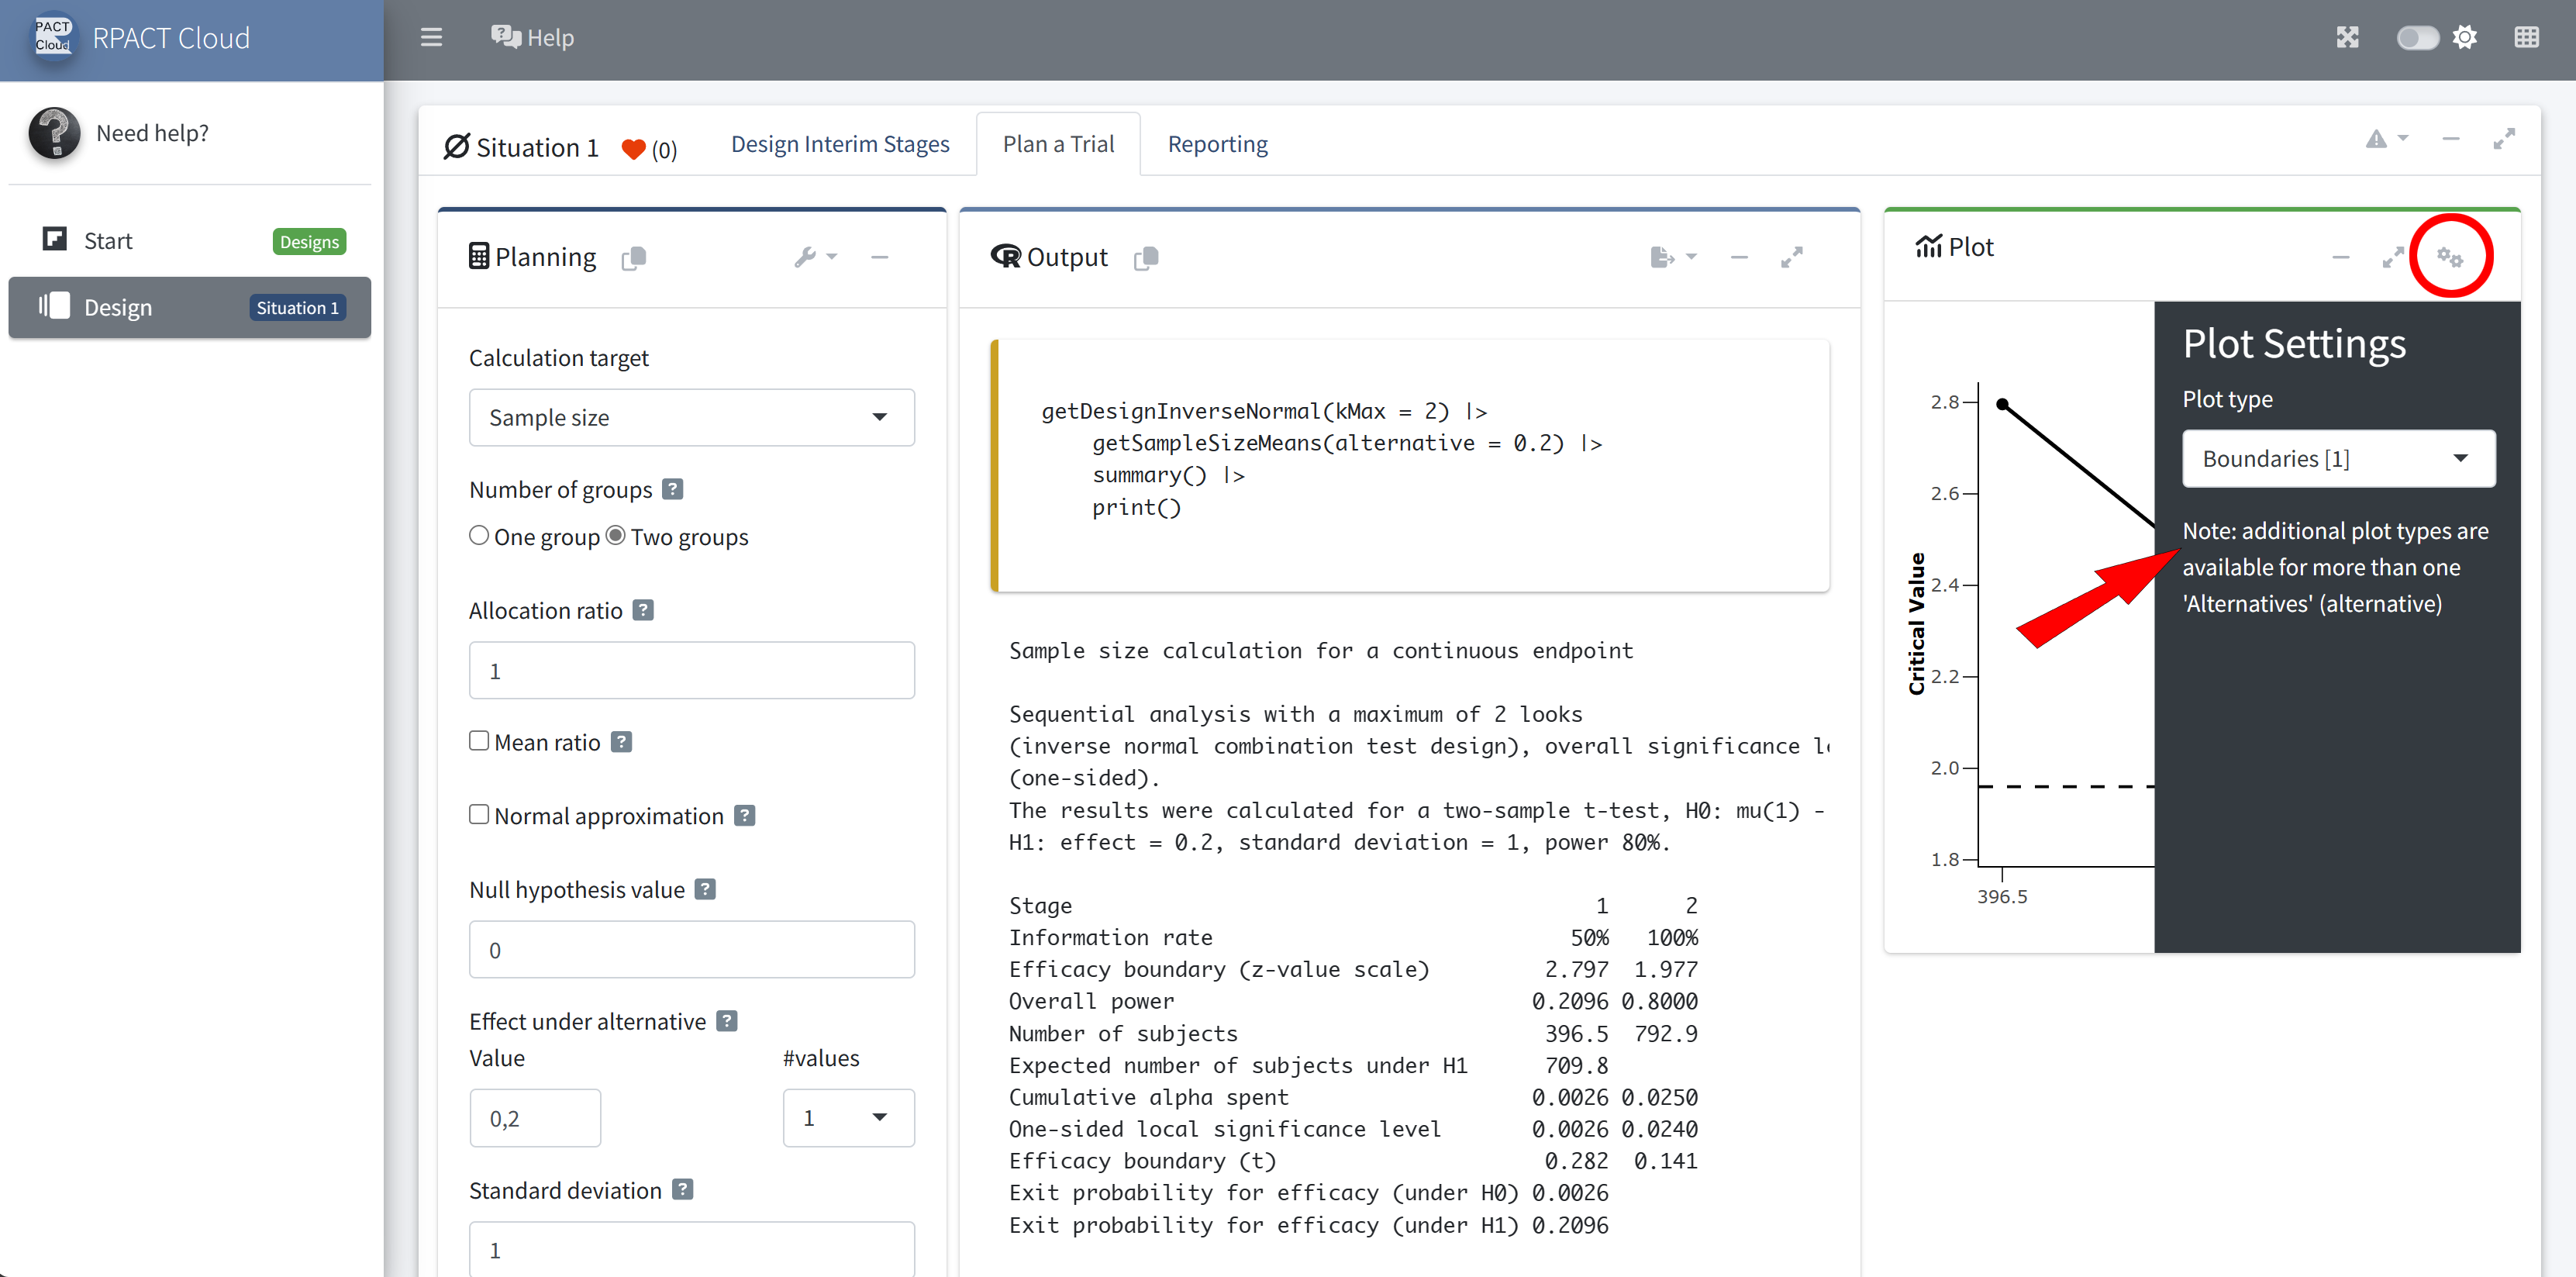
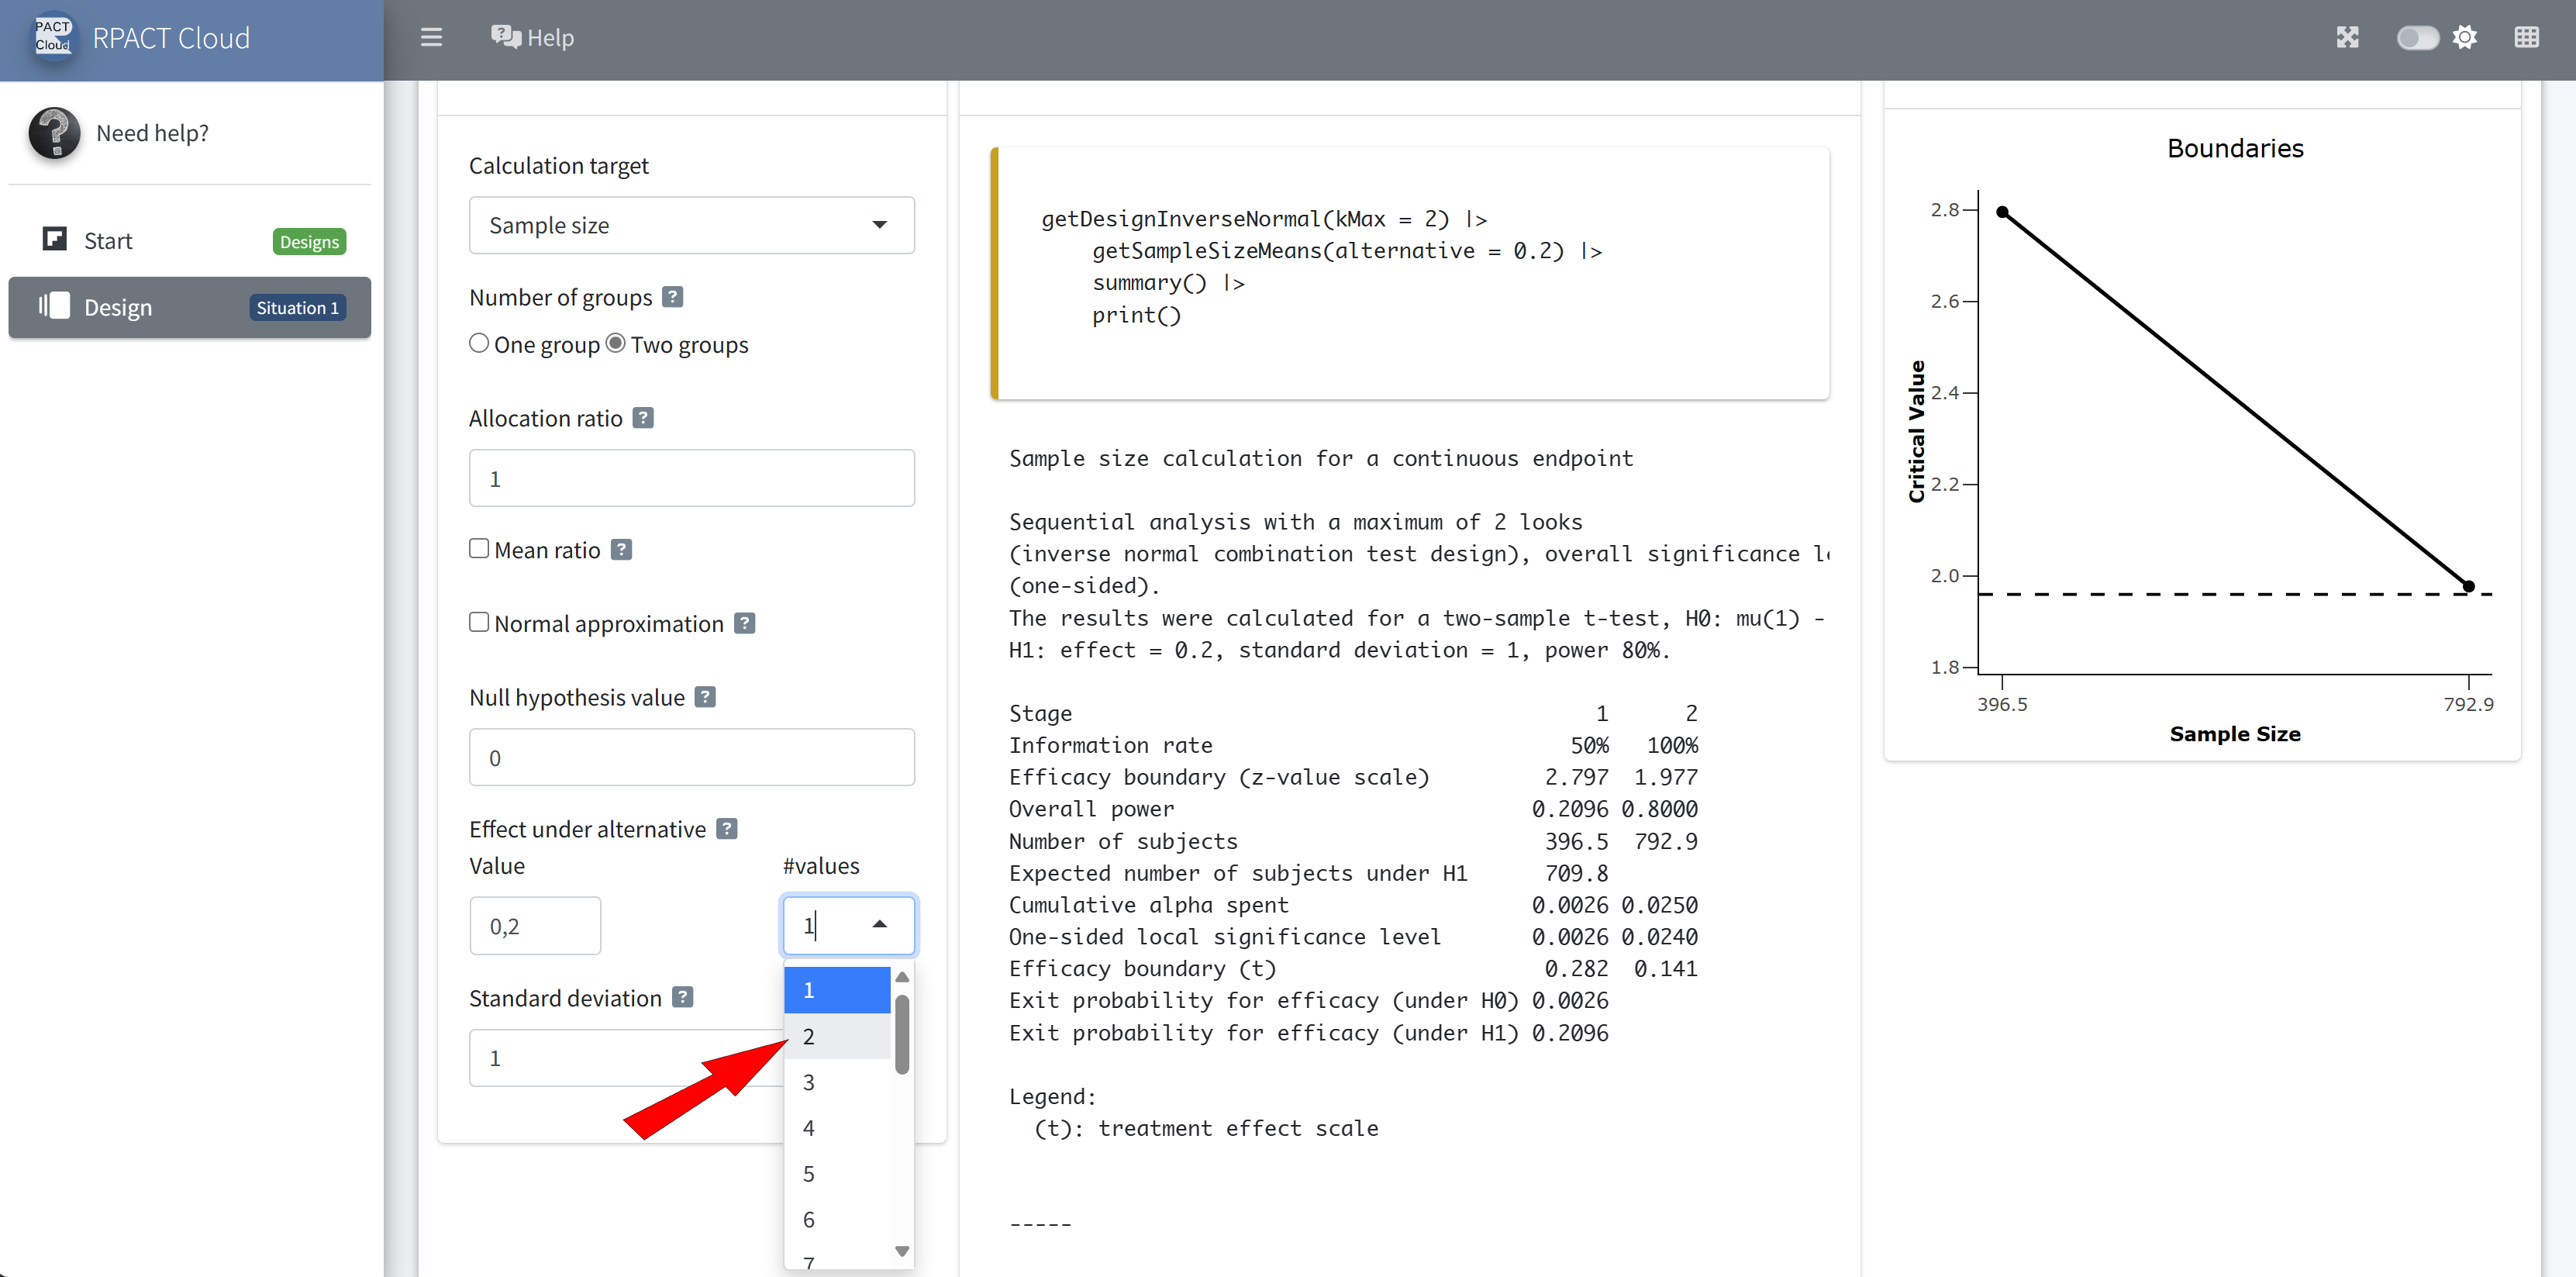
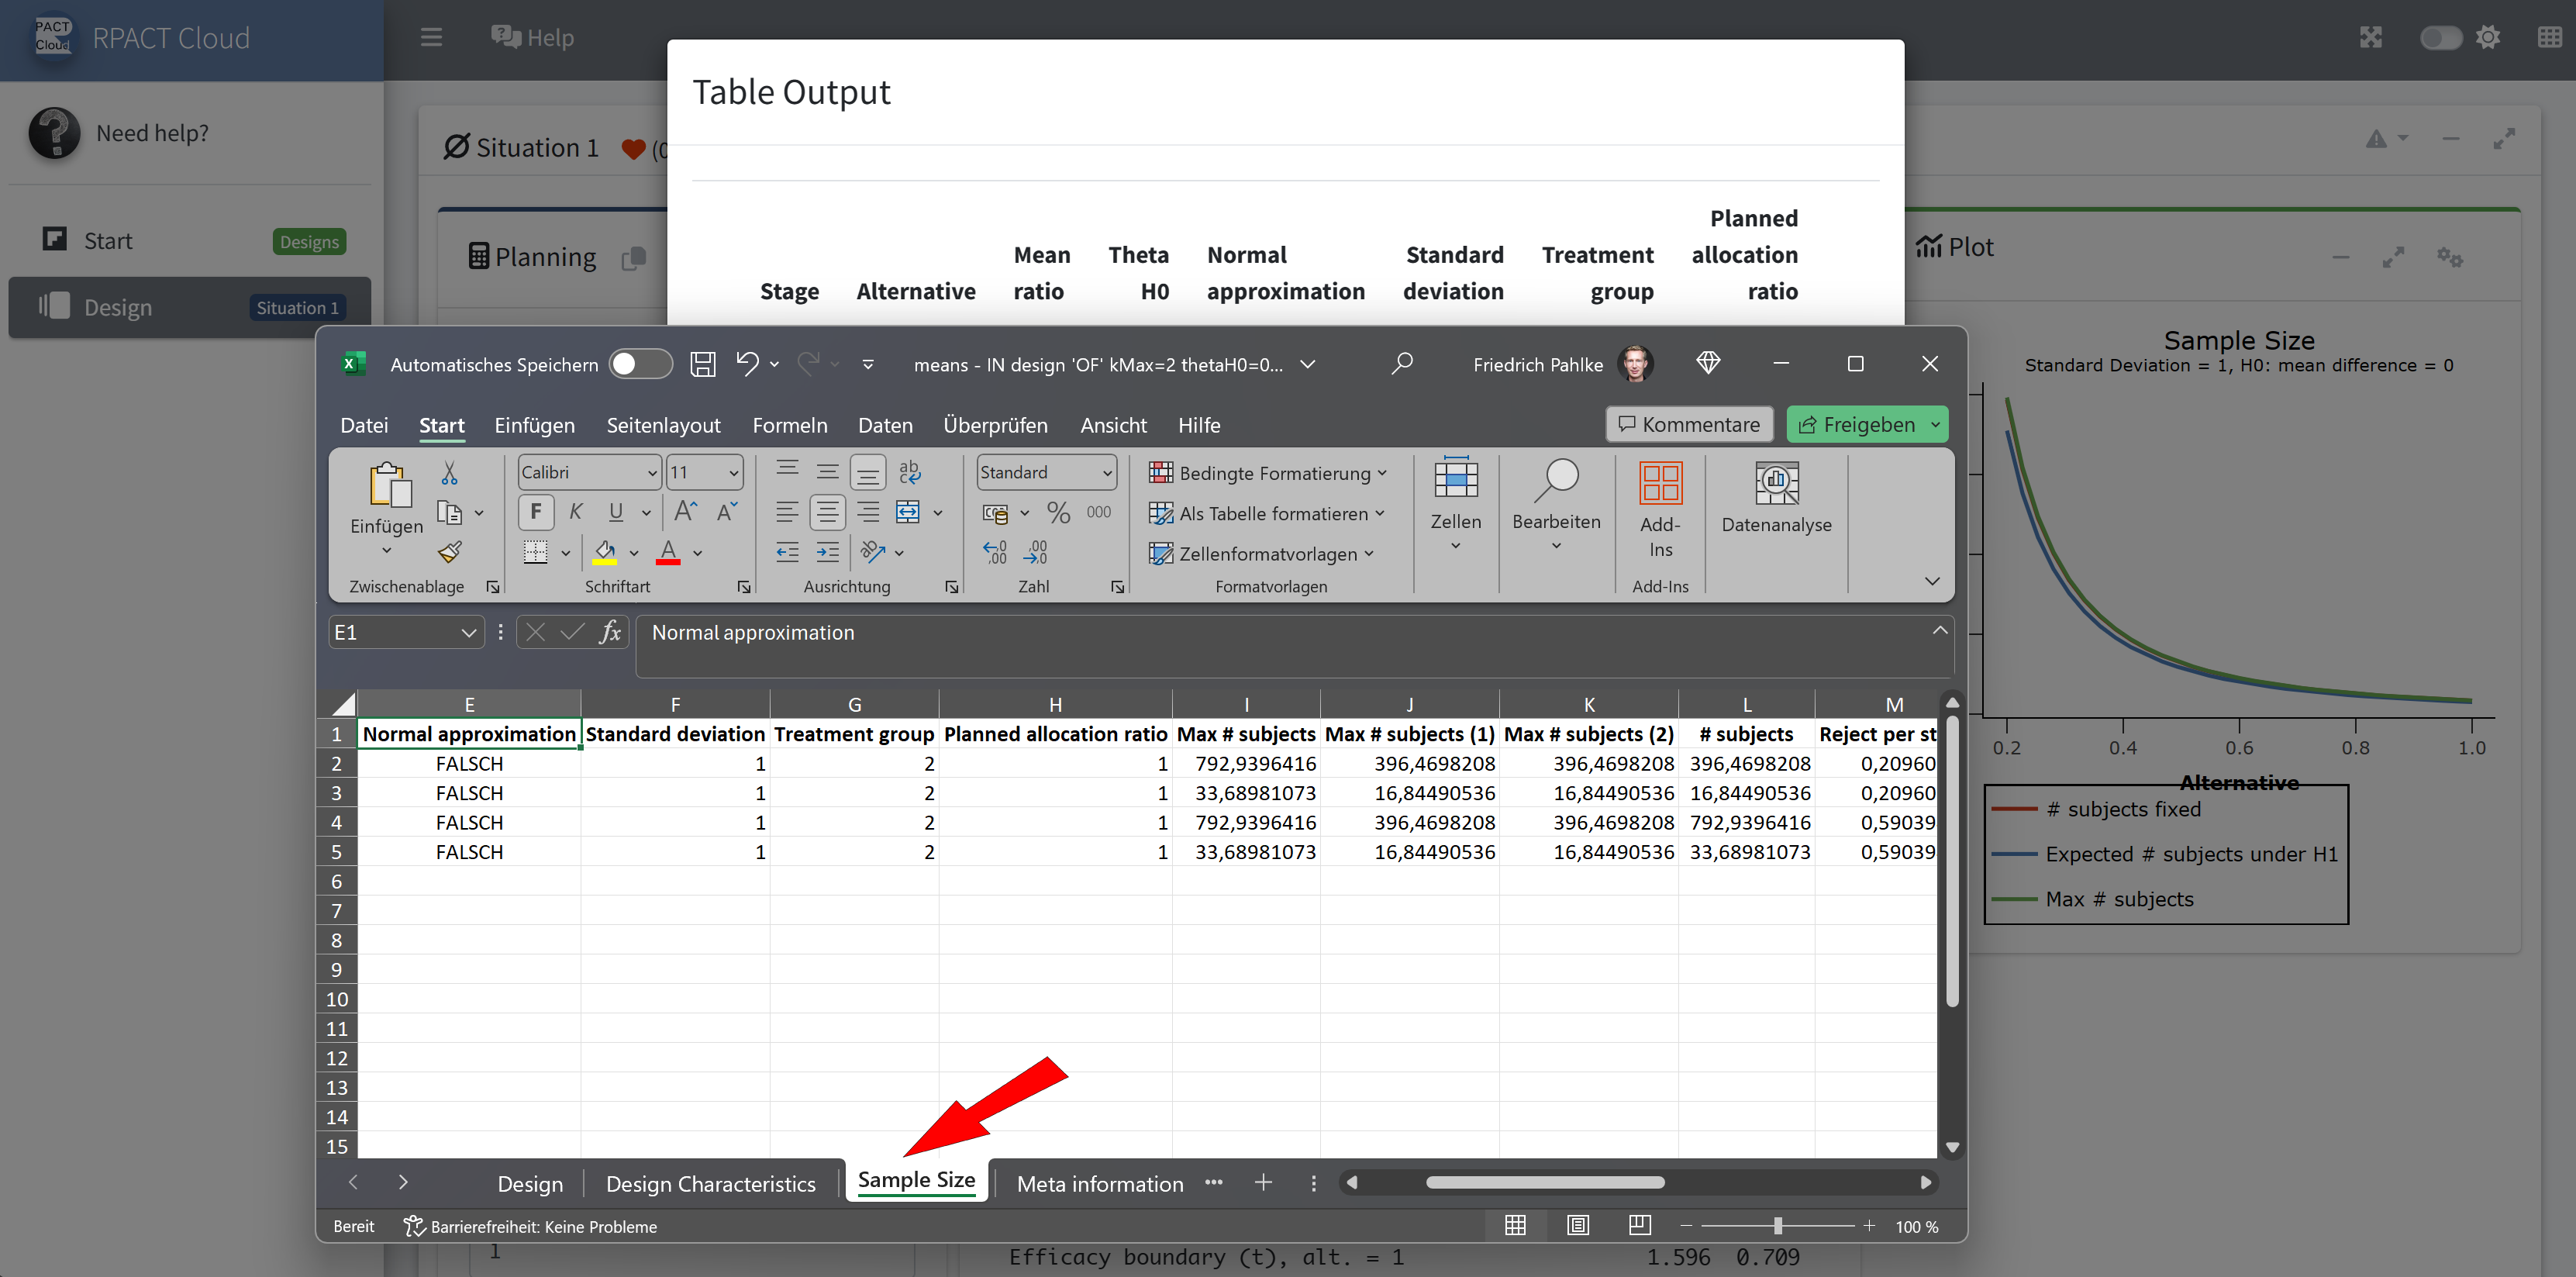
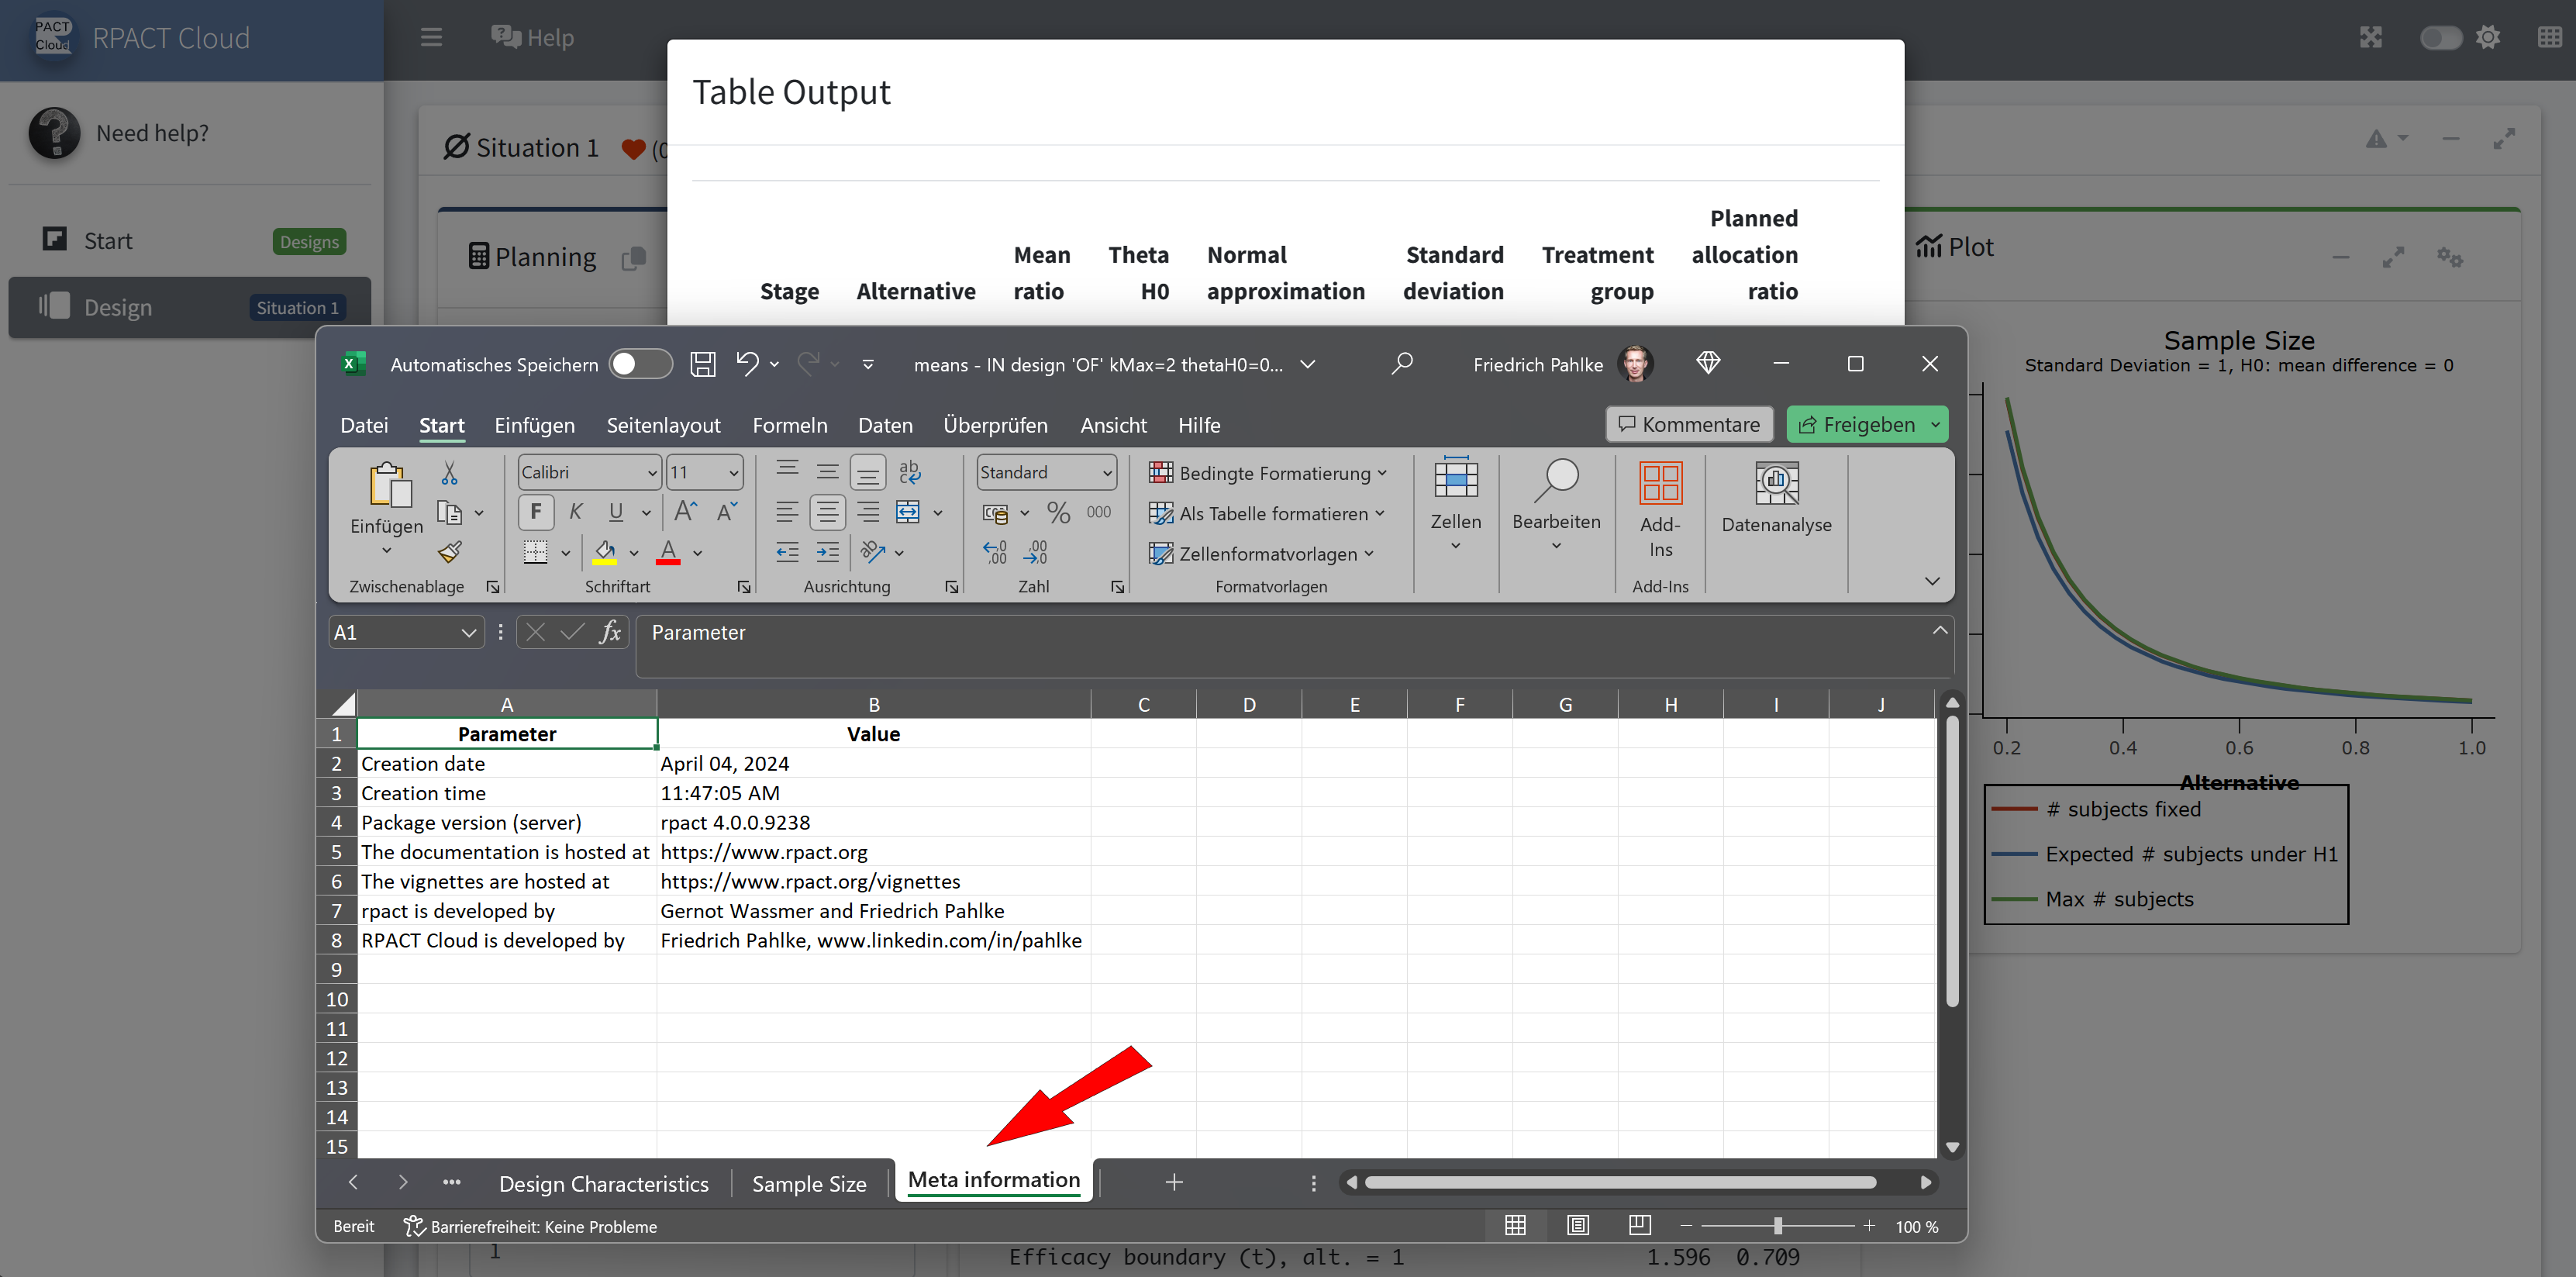
RPACT Cloud
![]()
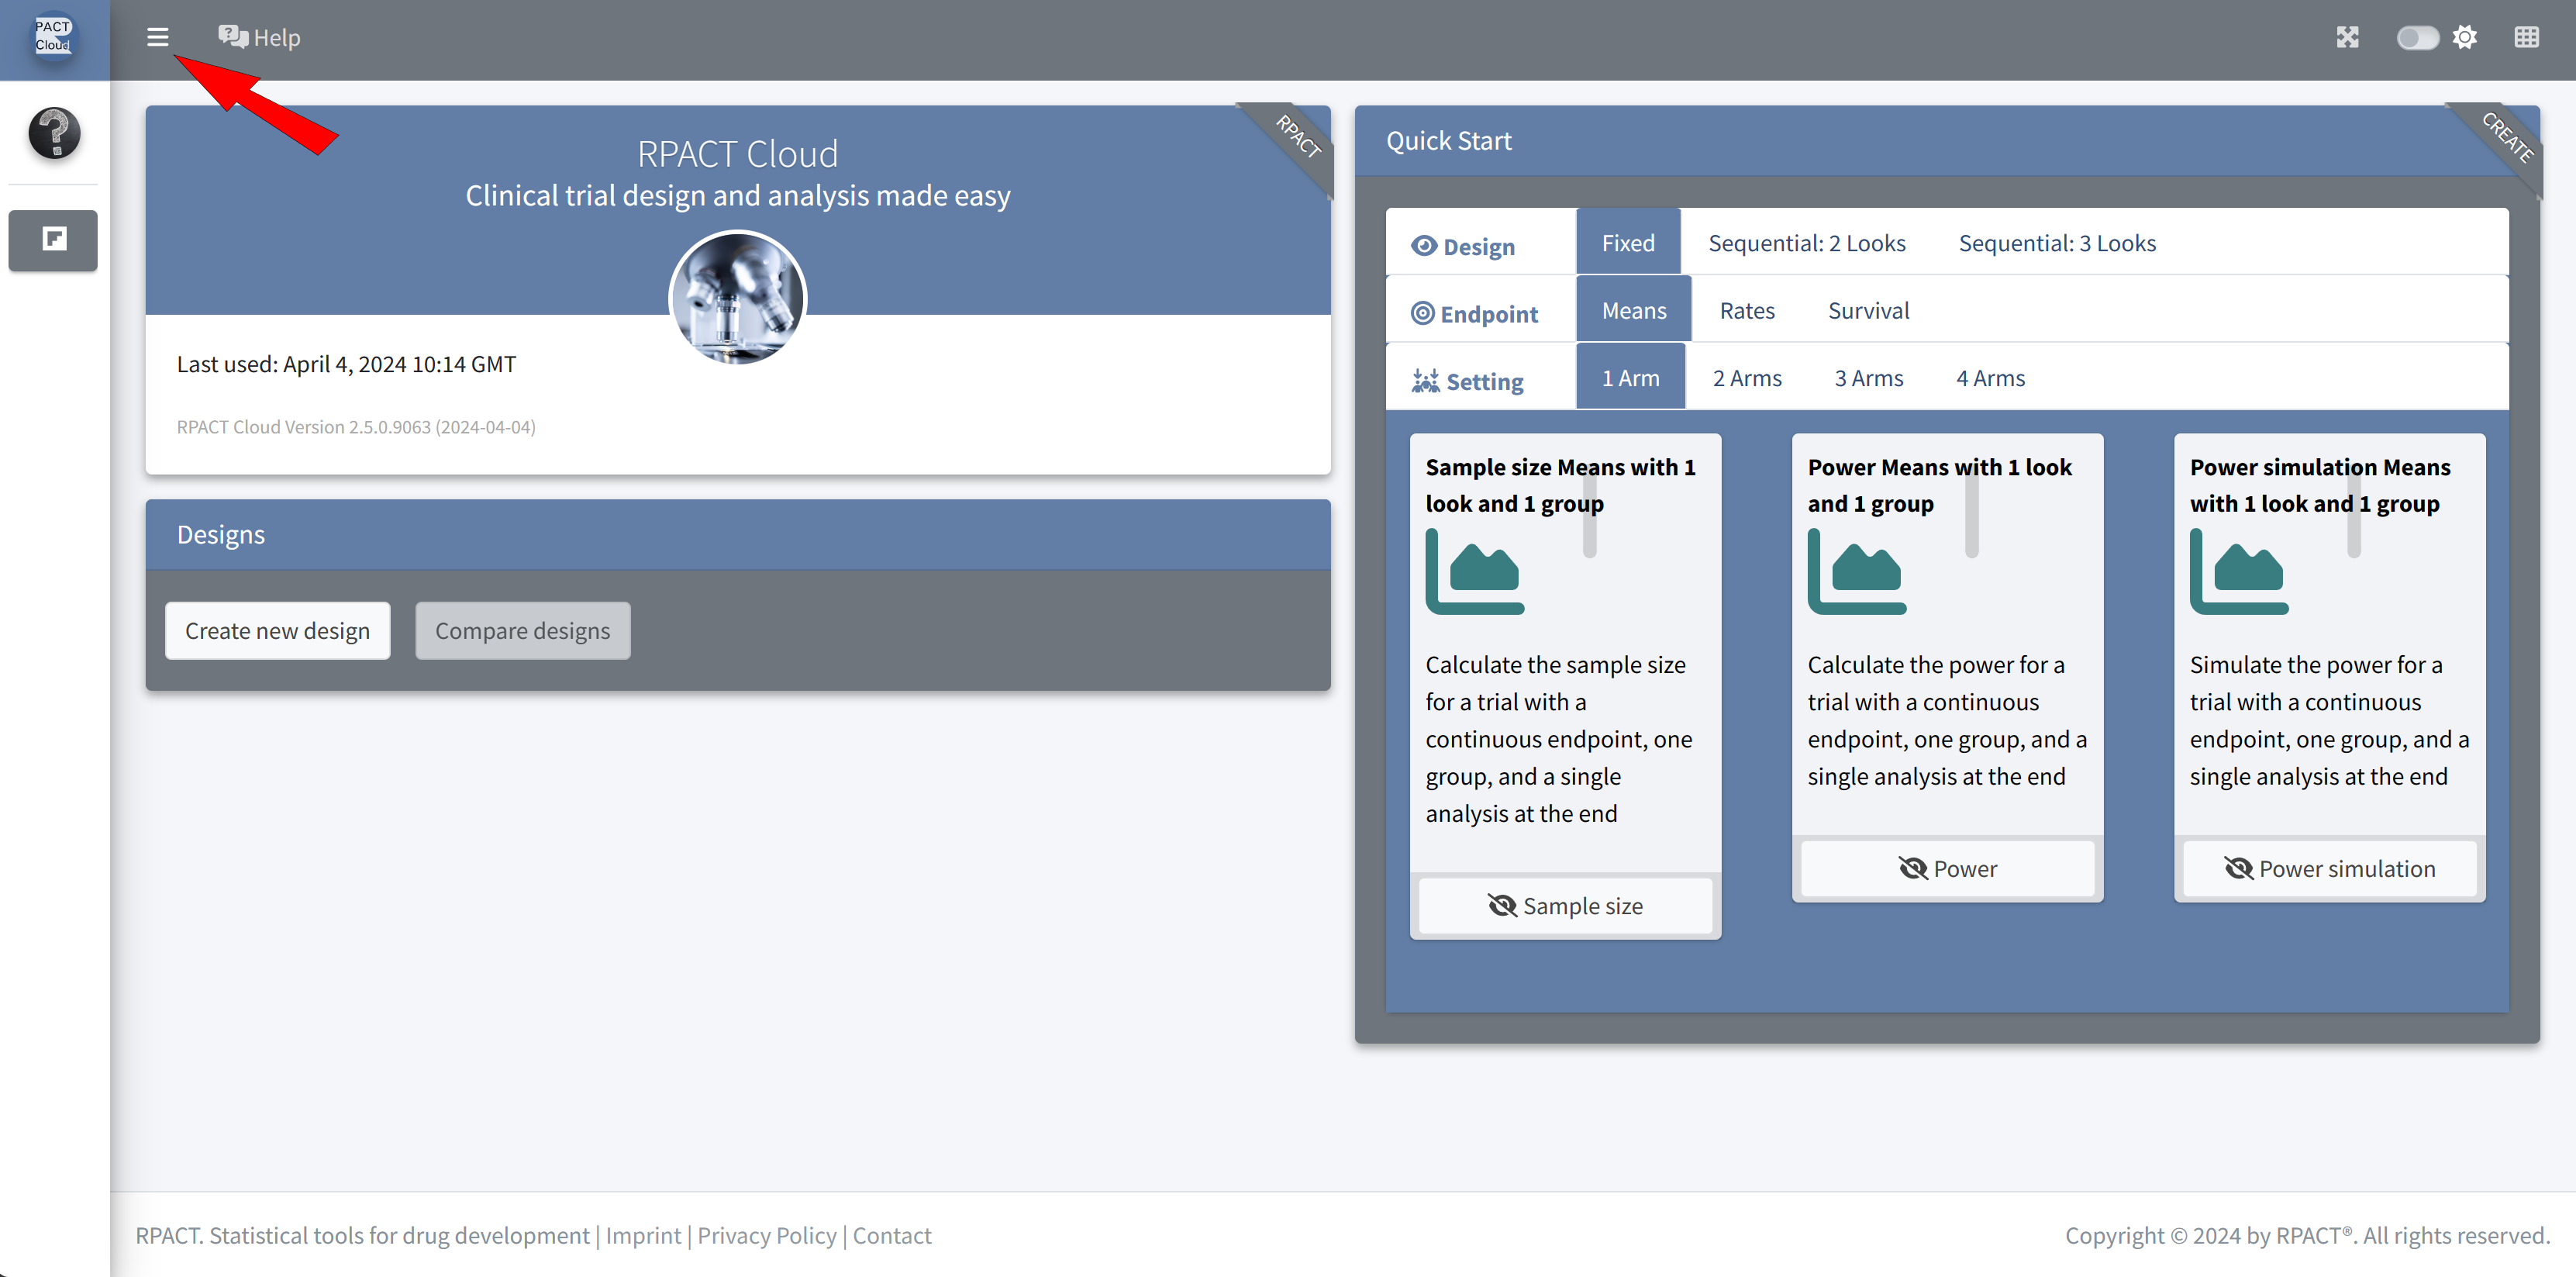
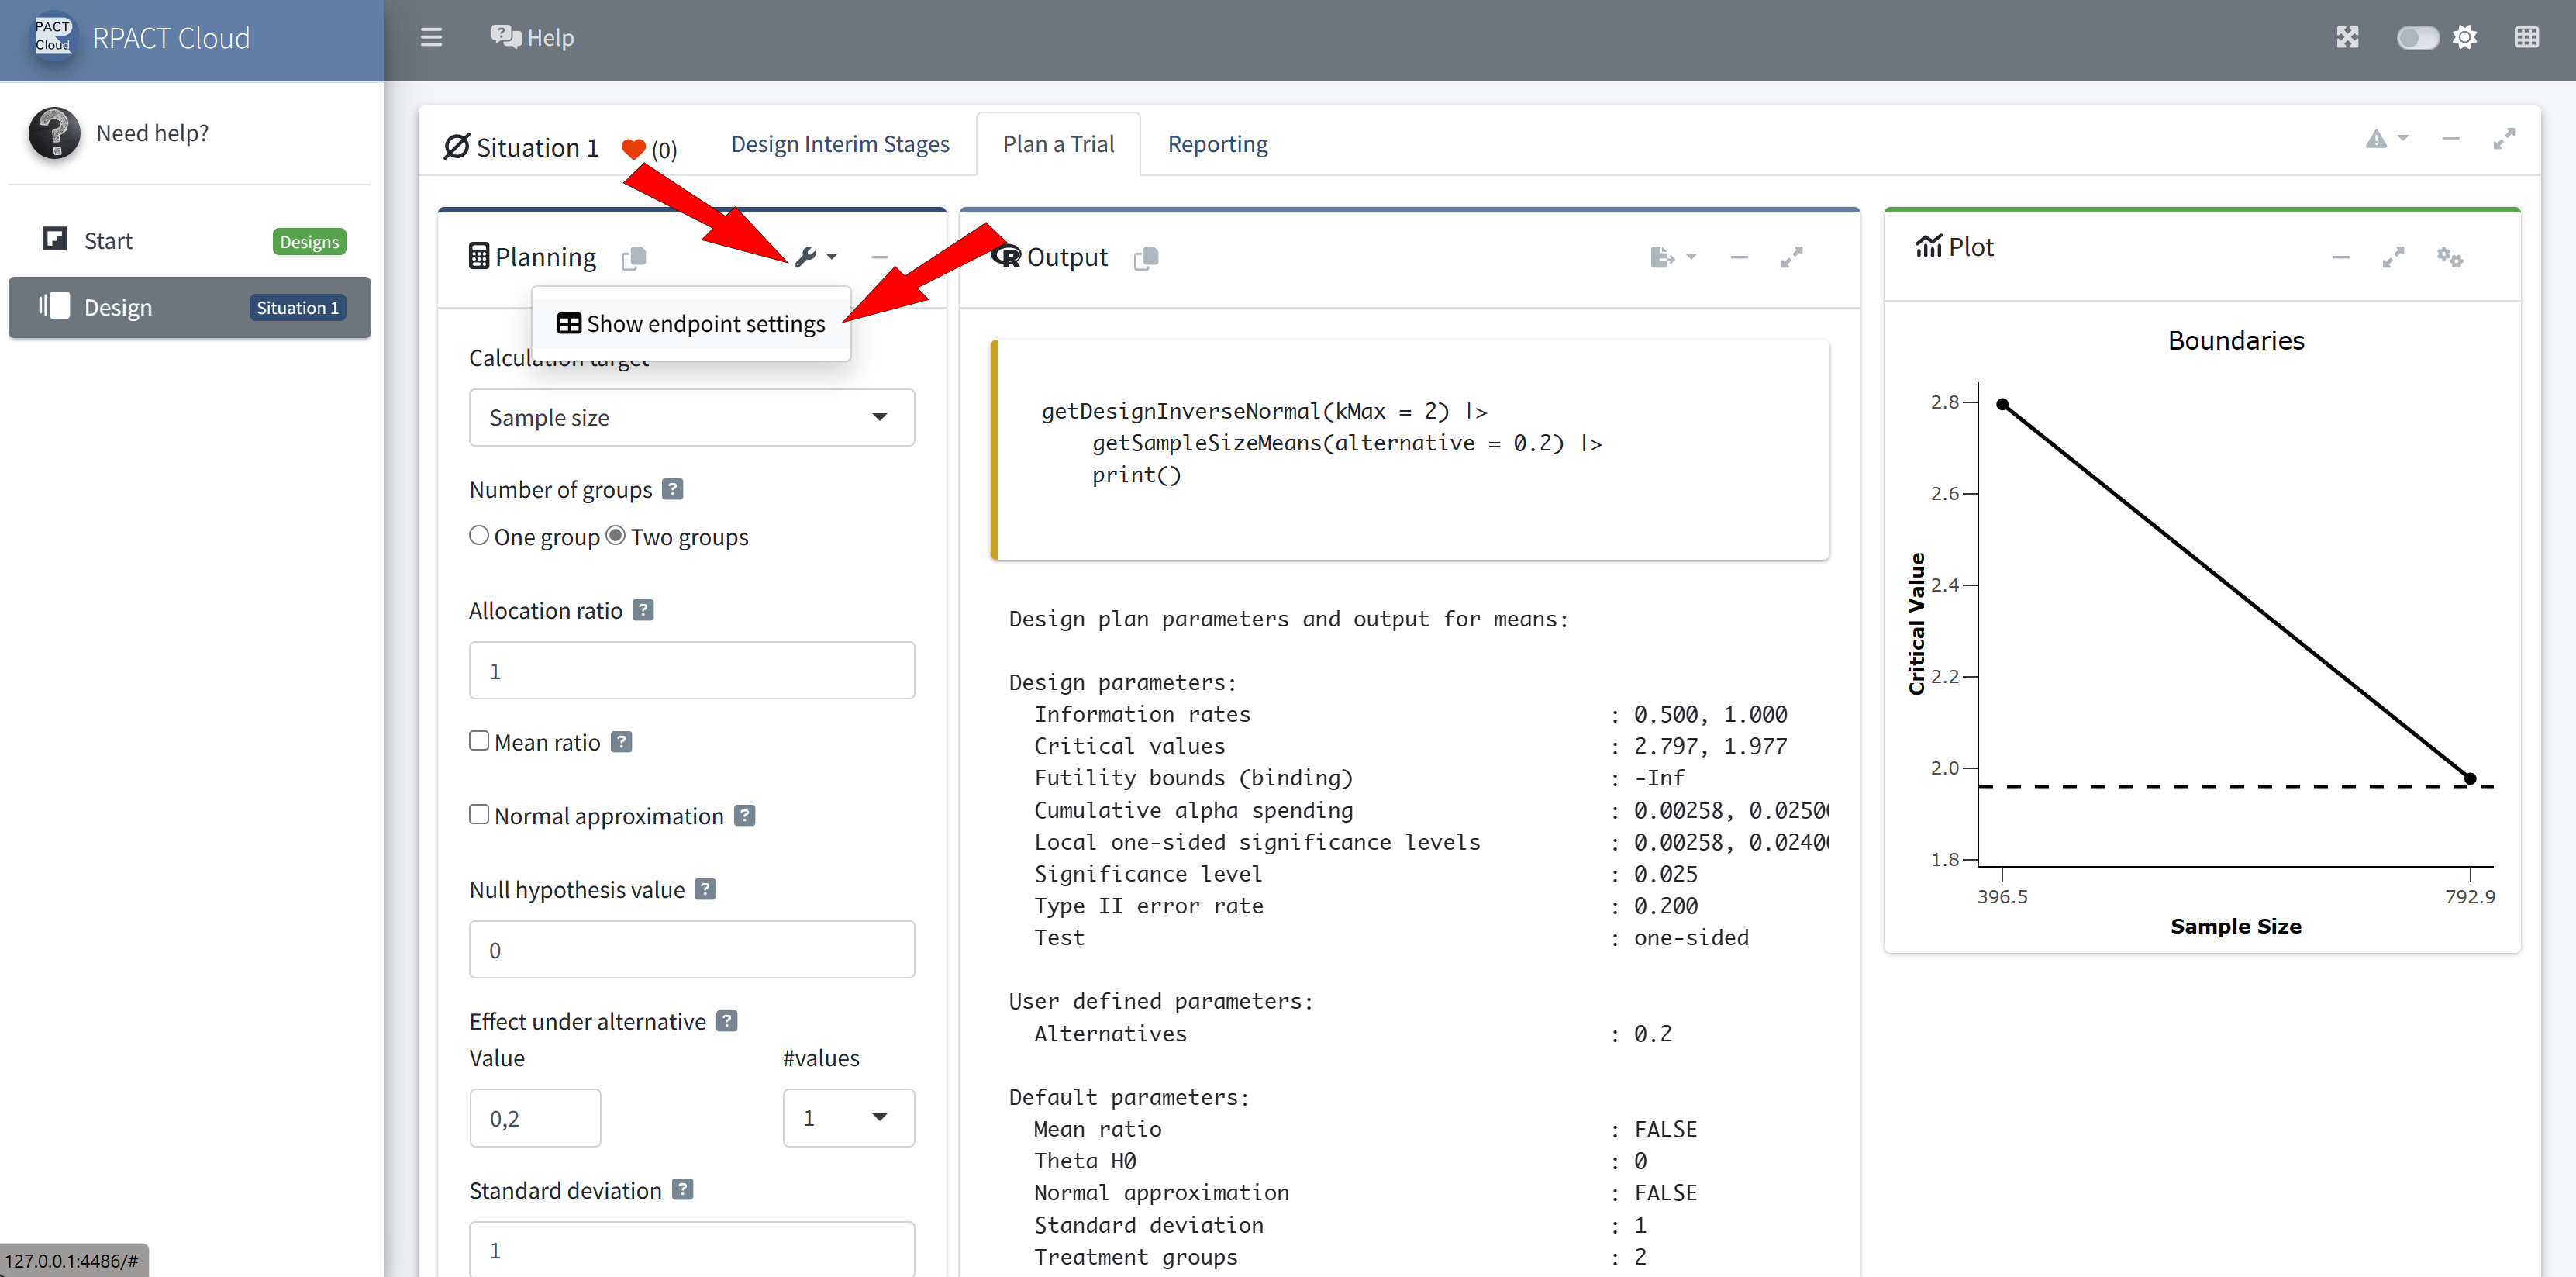
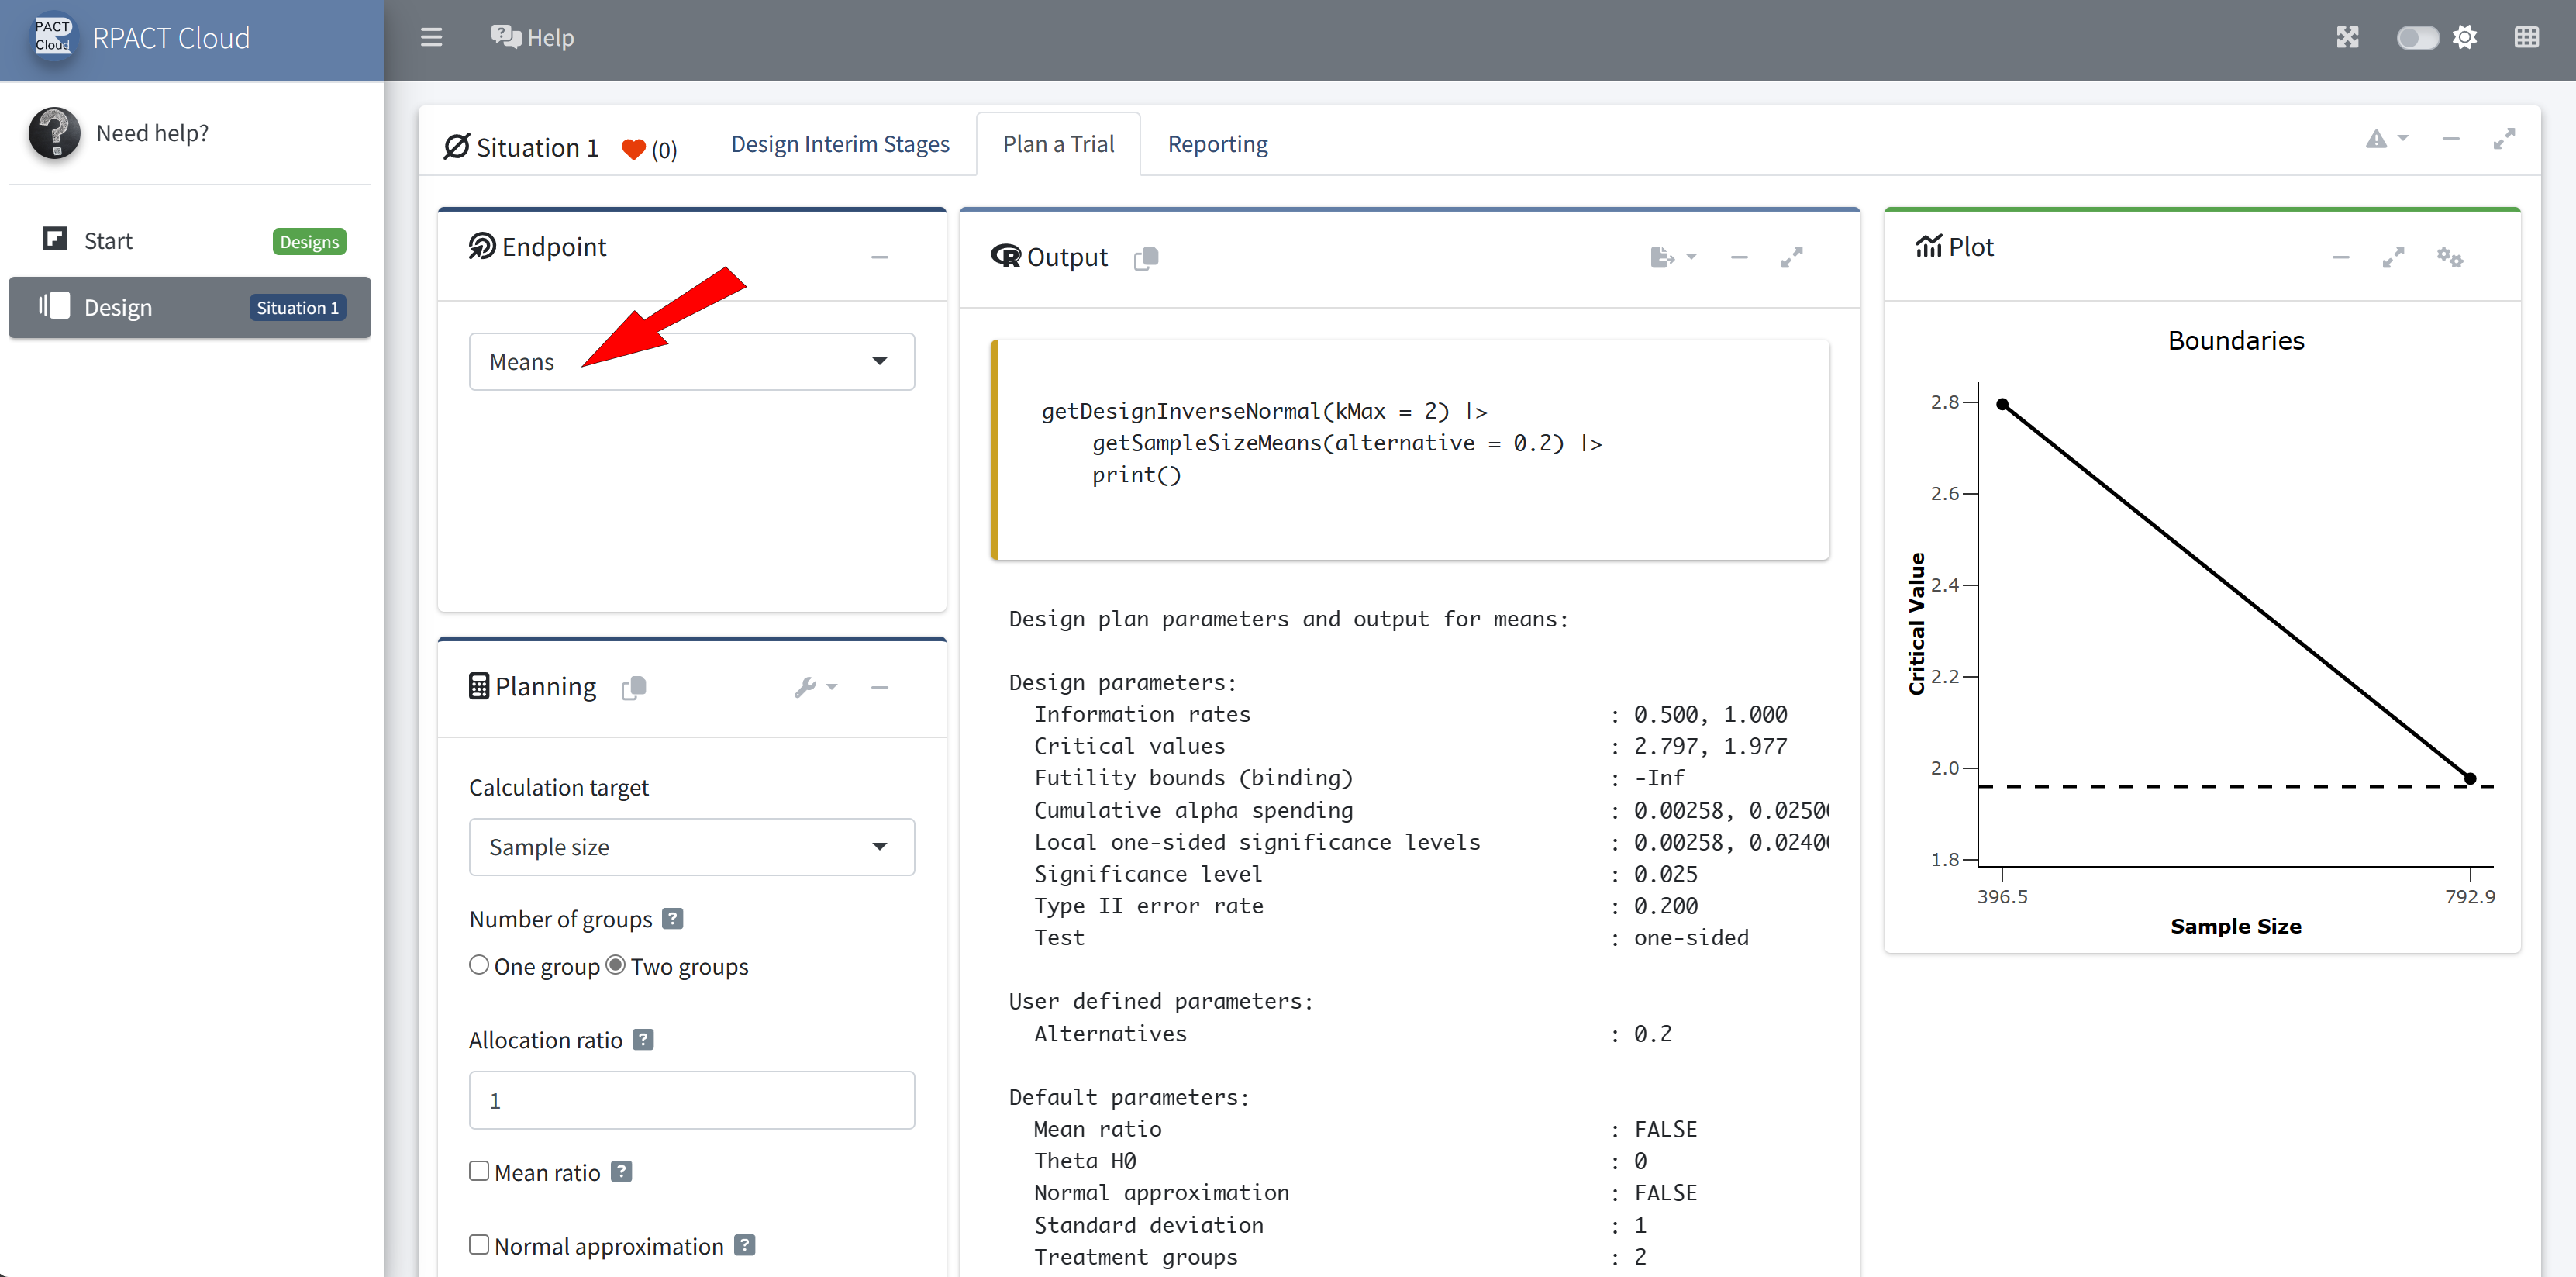
RPACT Cloud – Basics
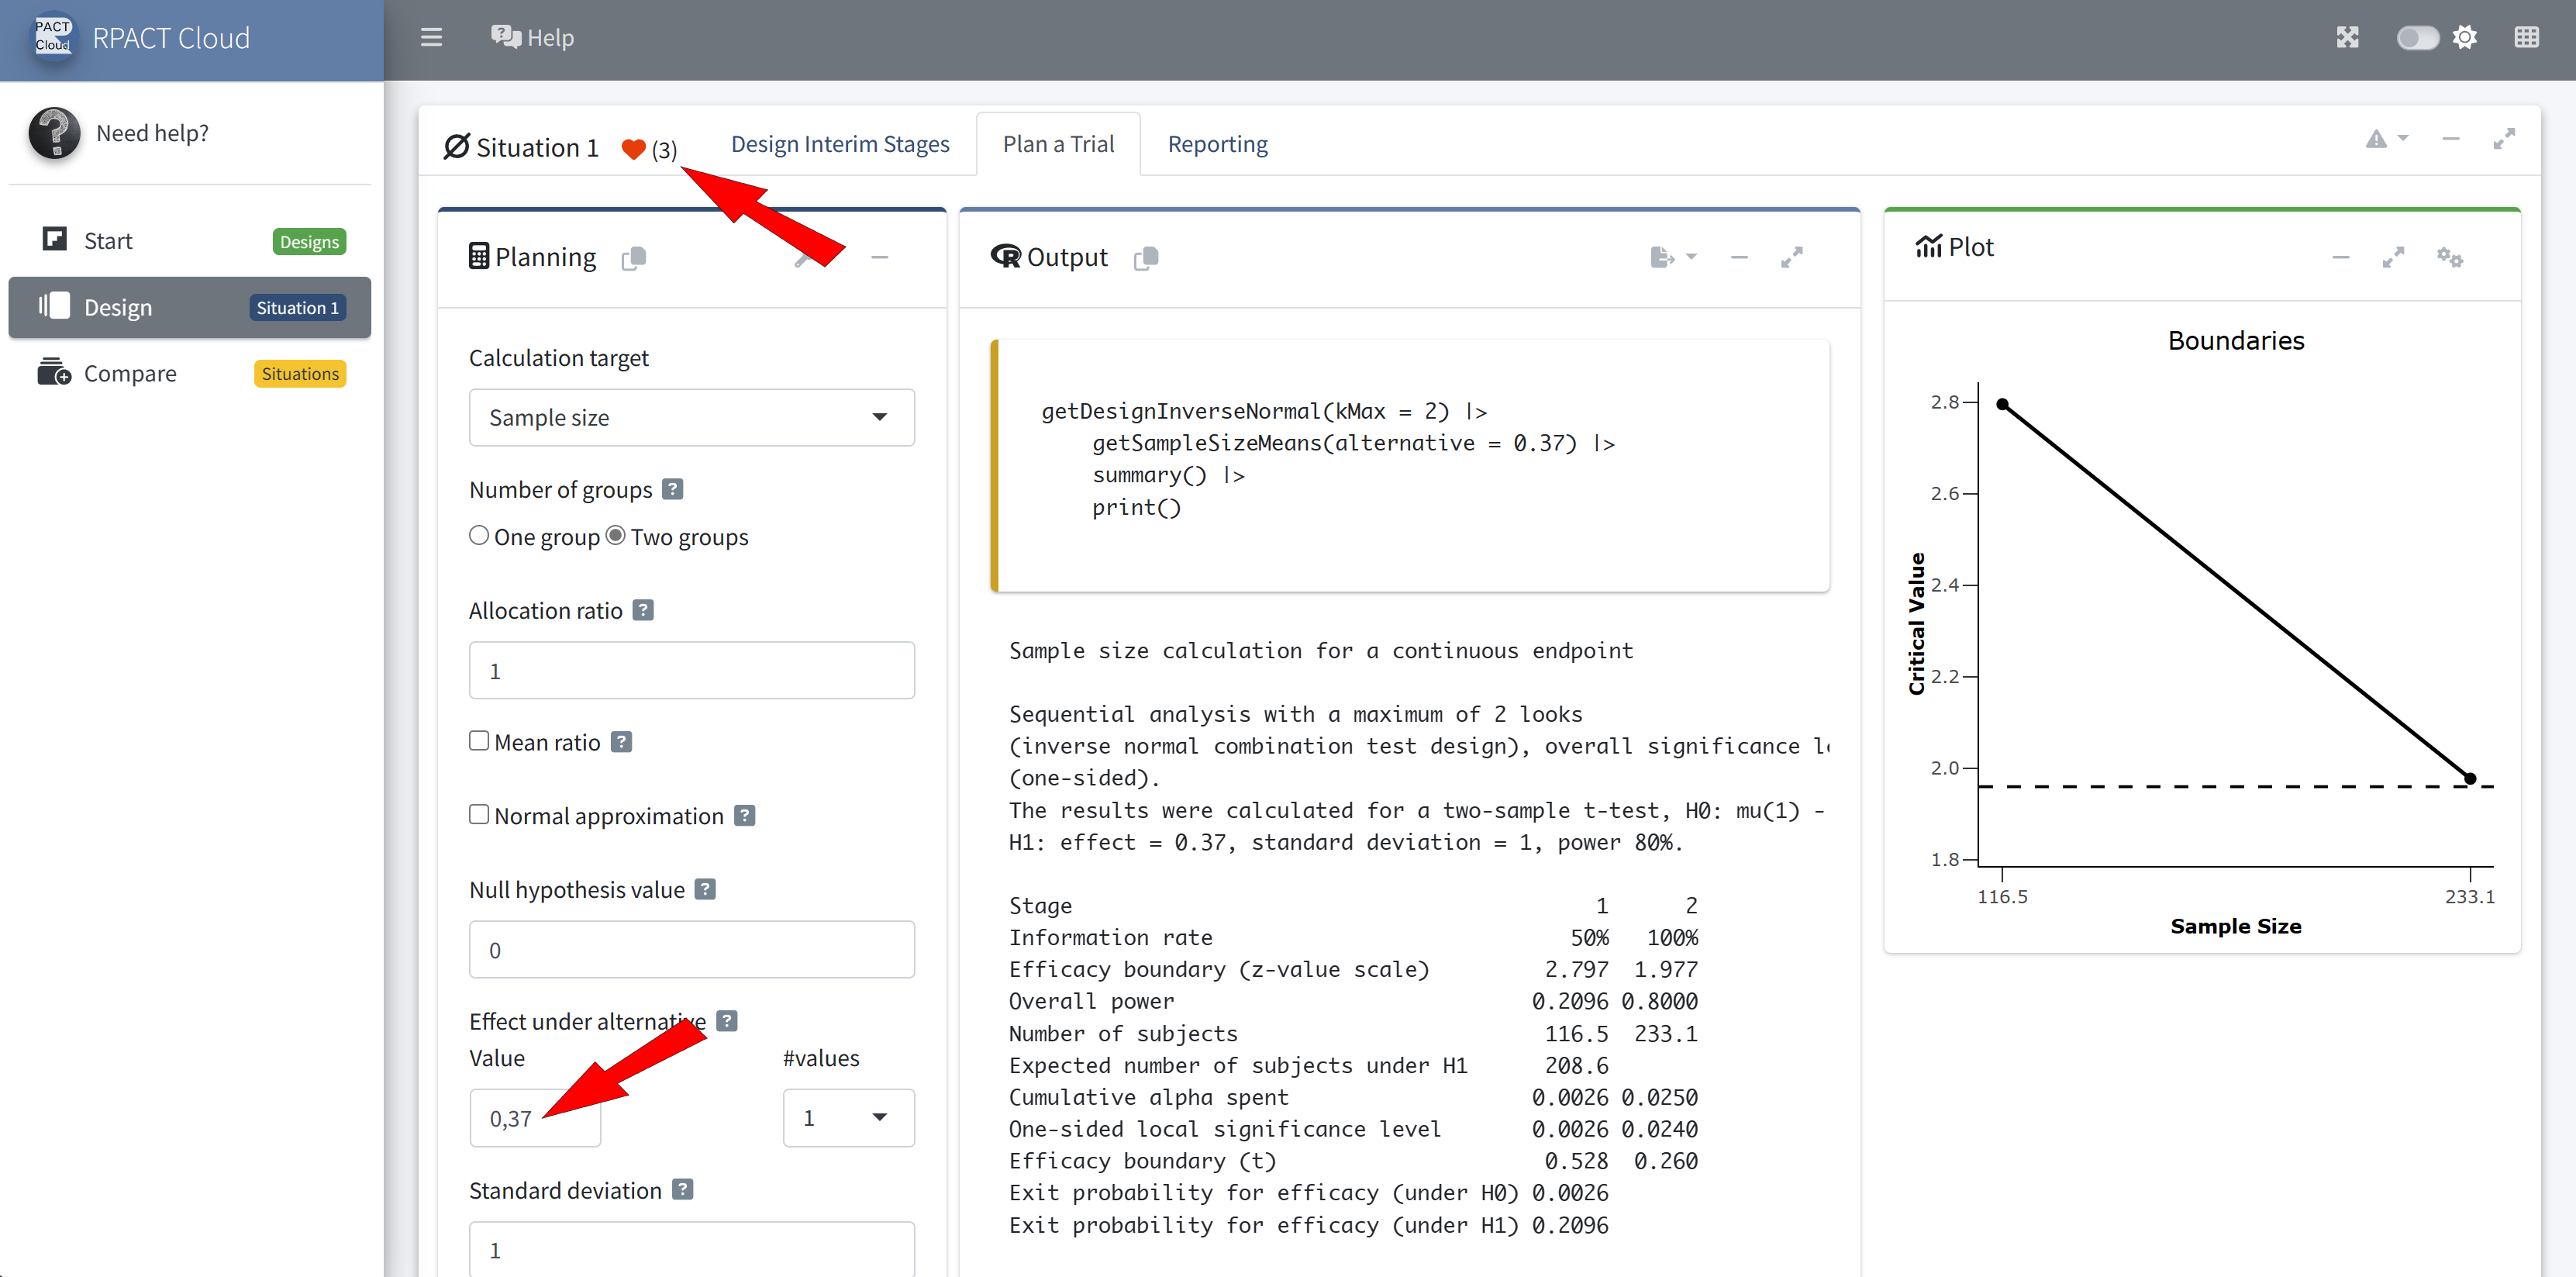
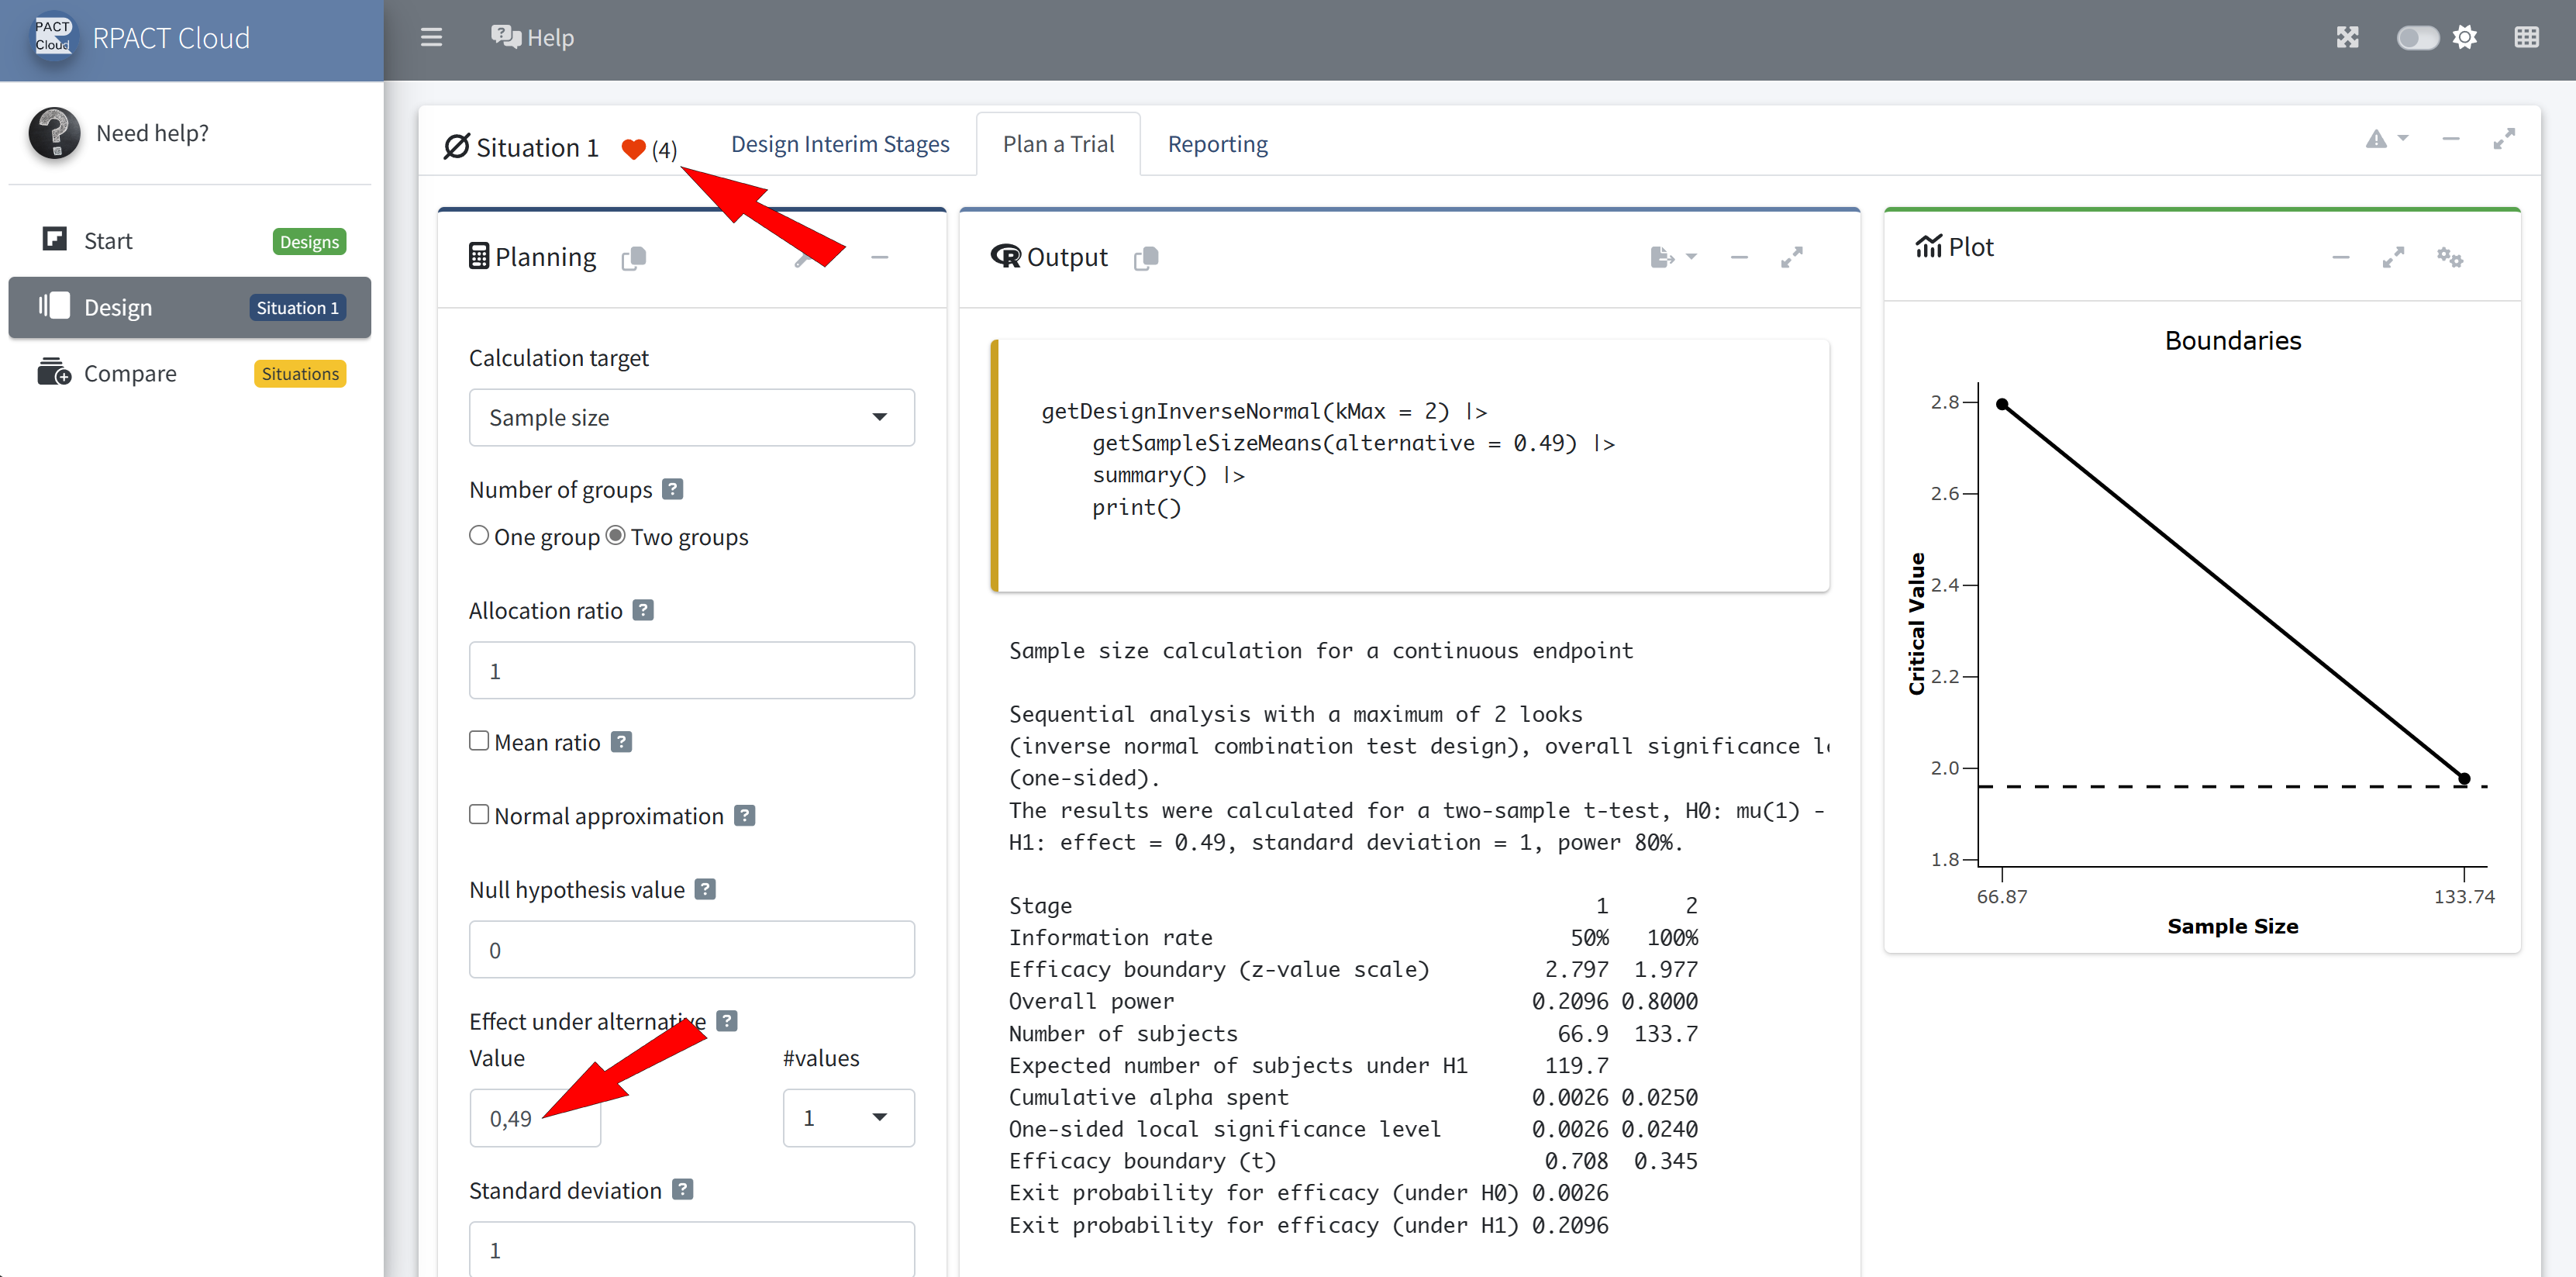
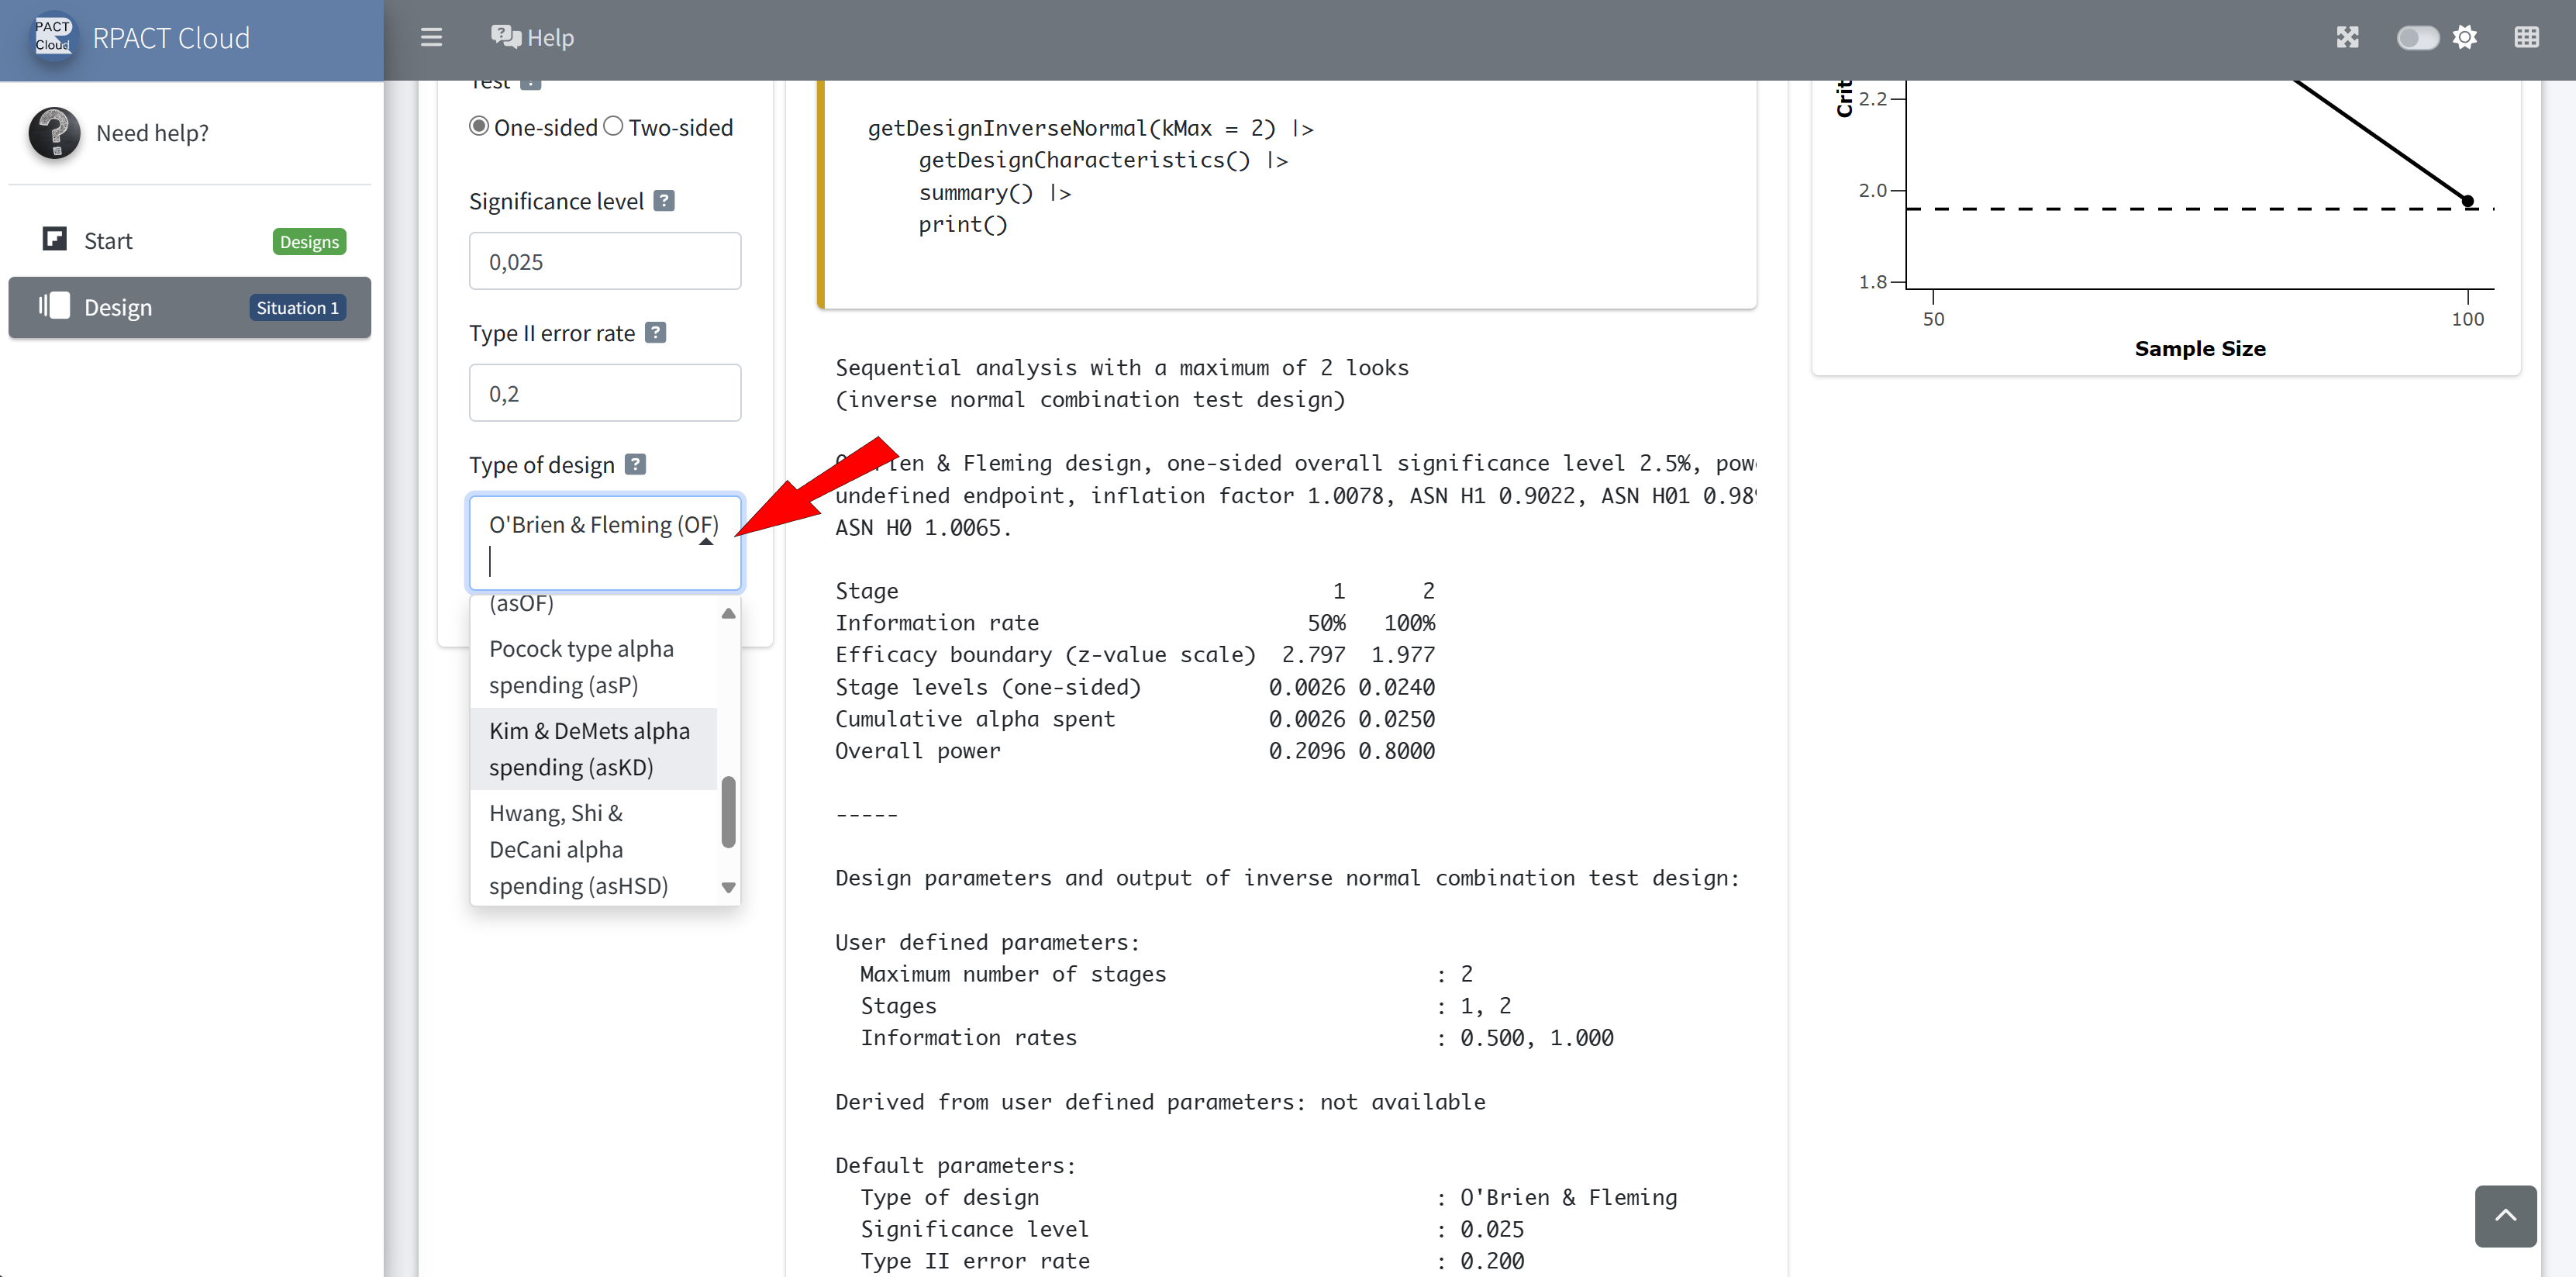
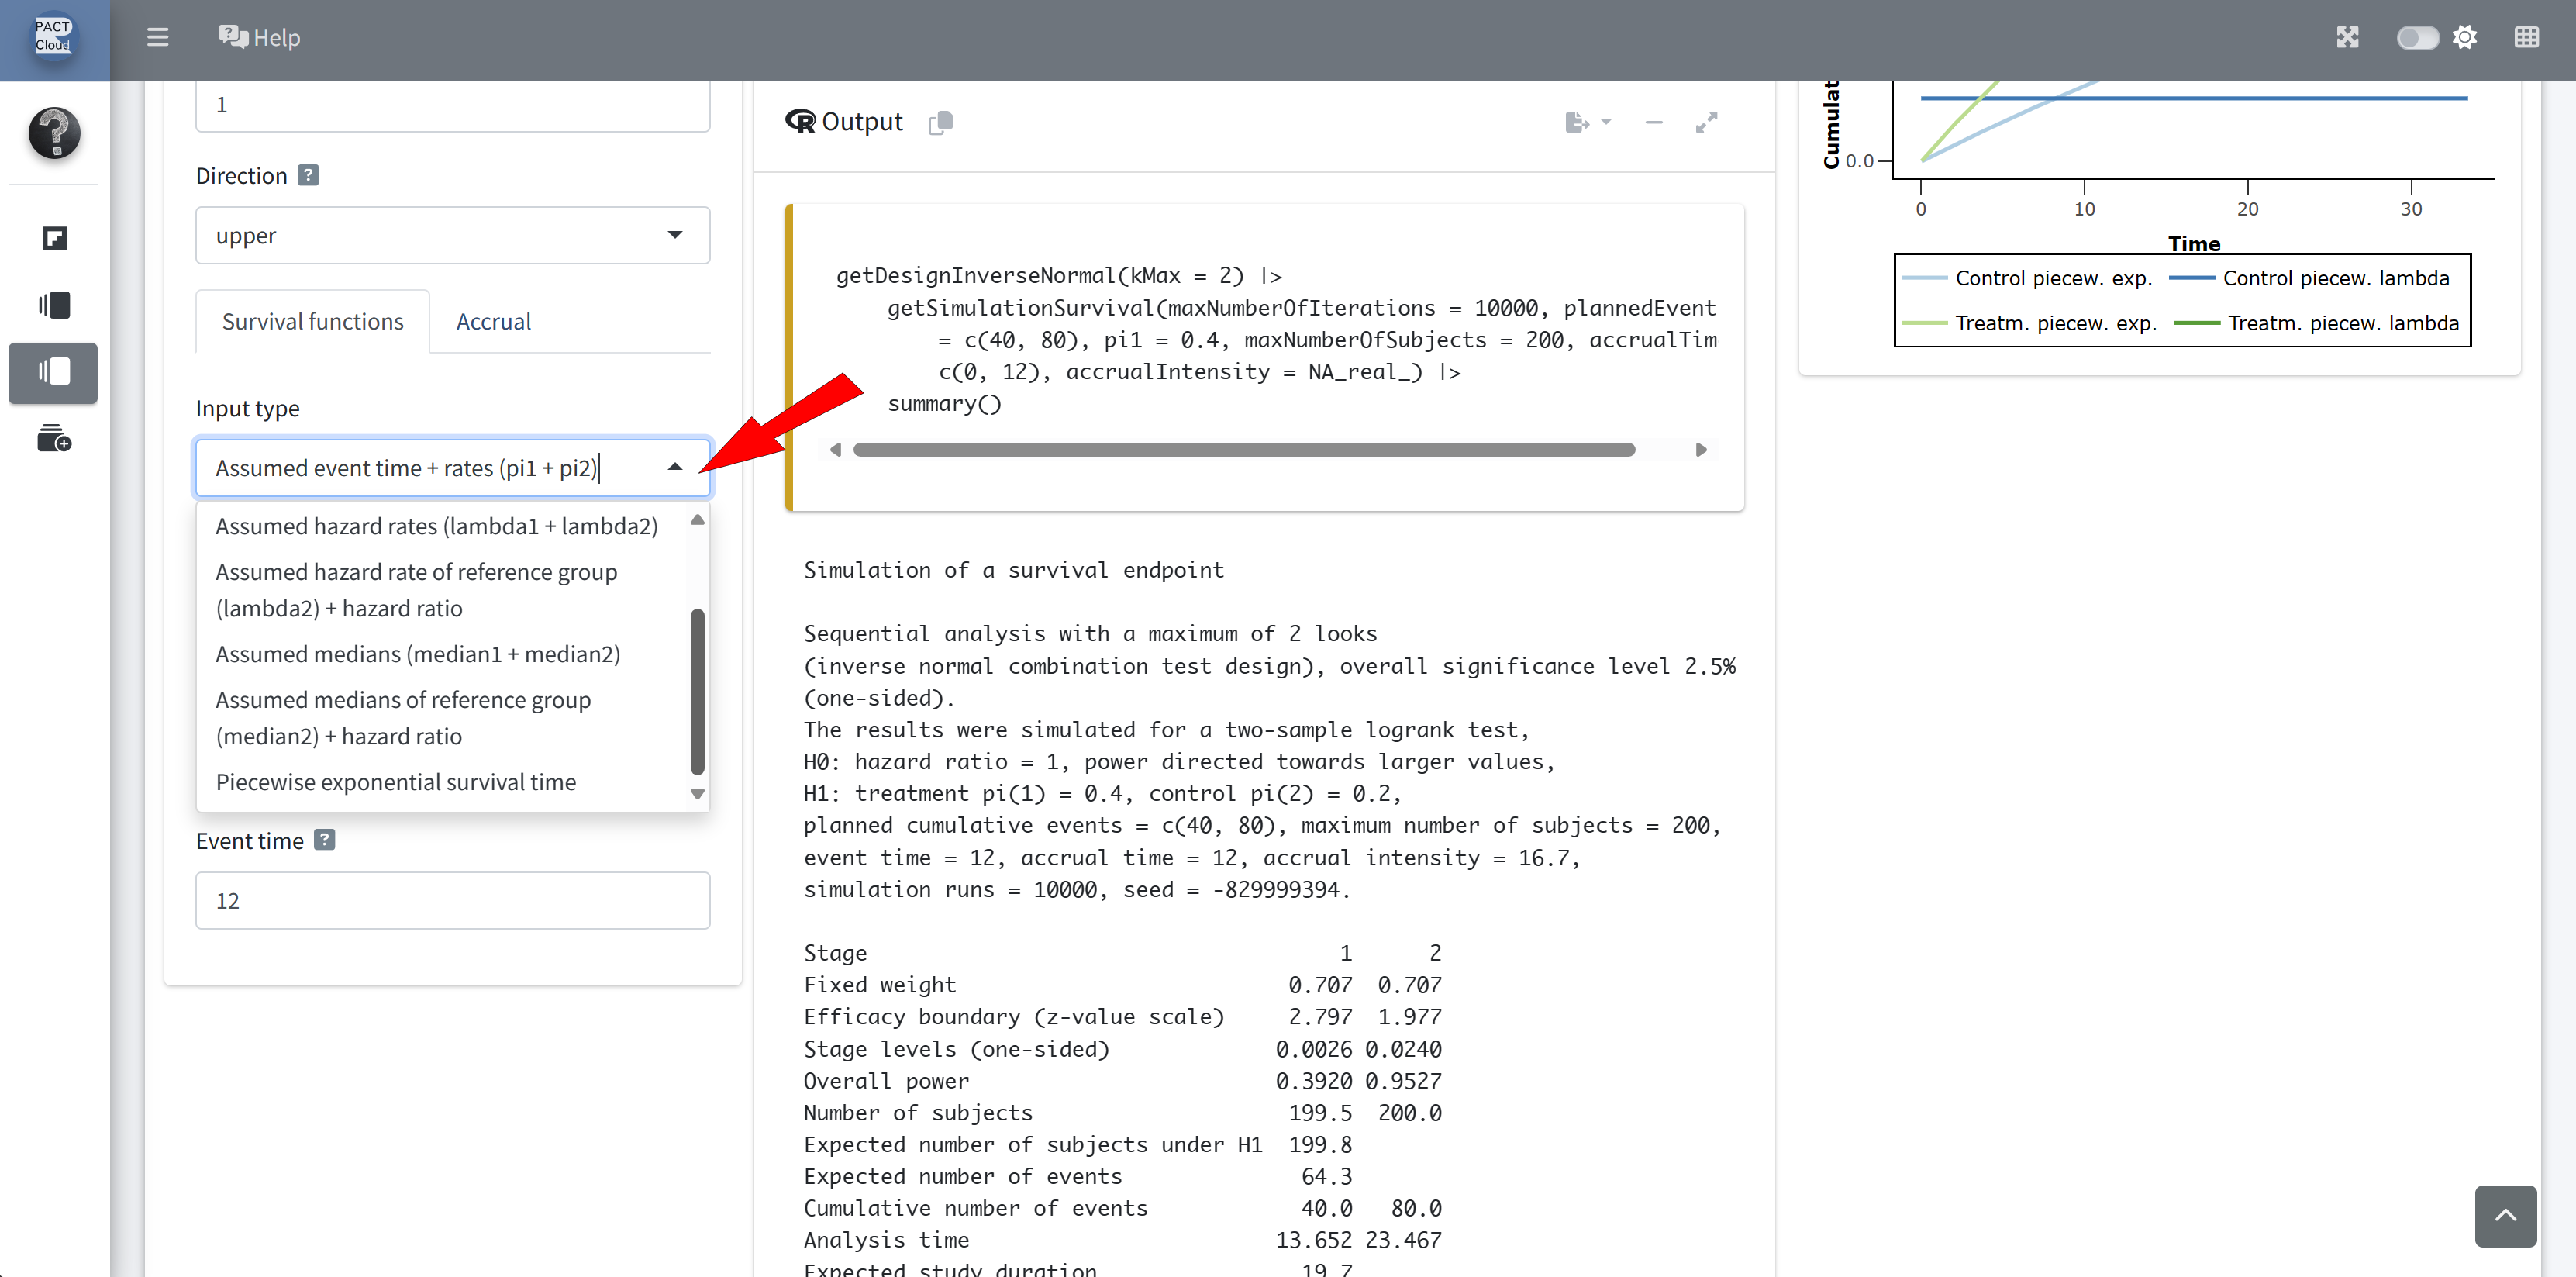
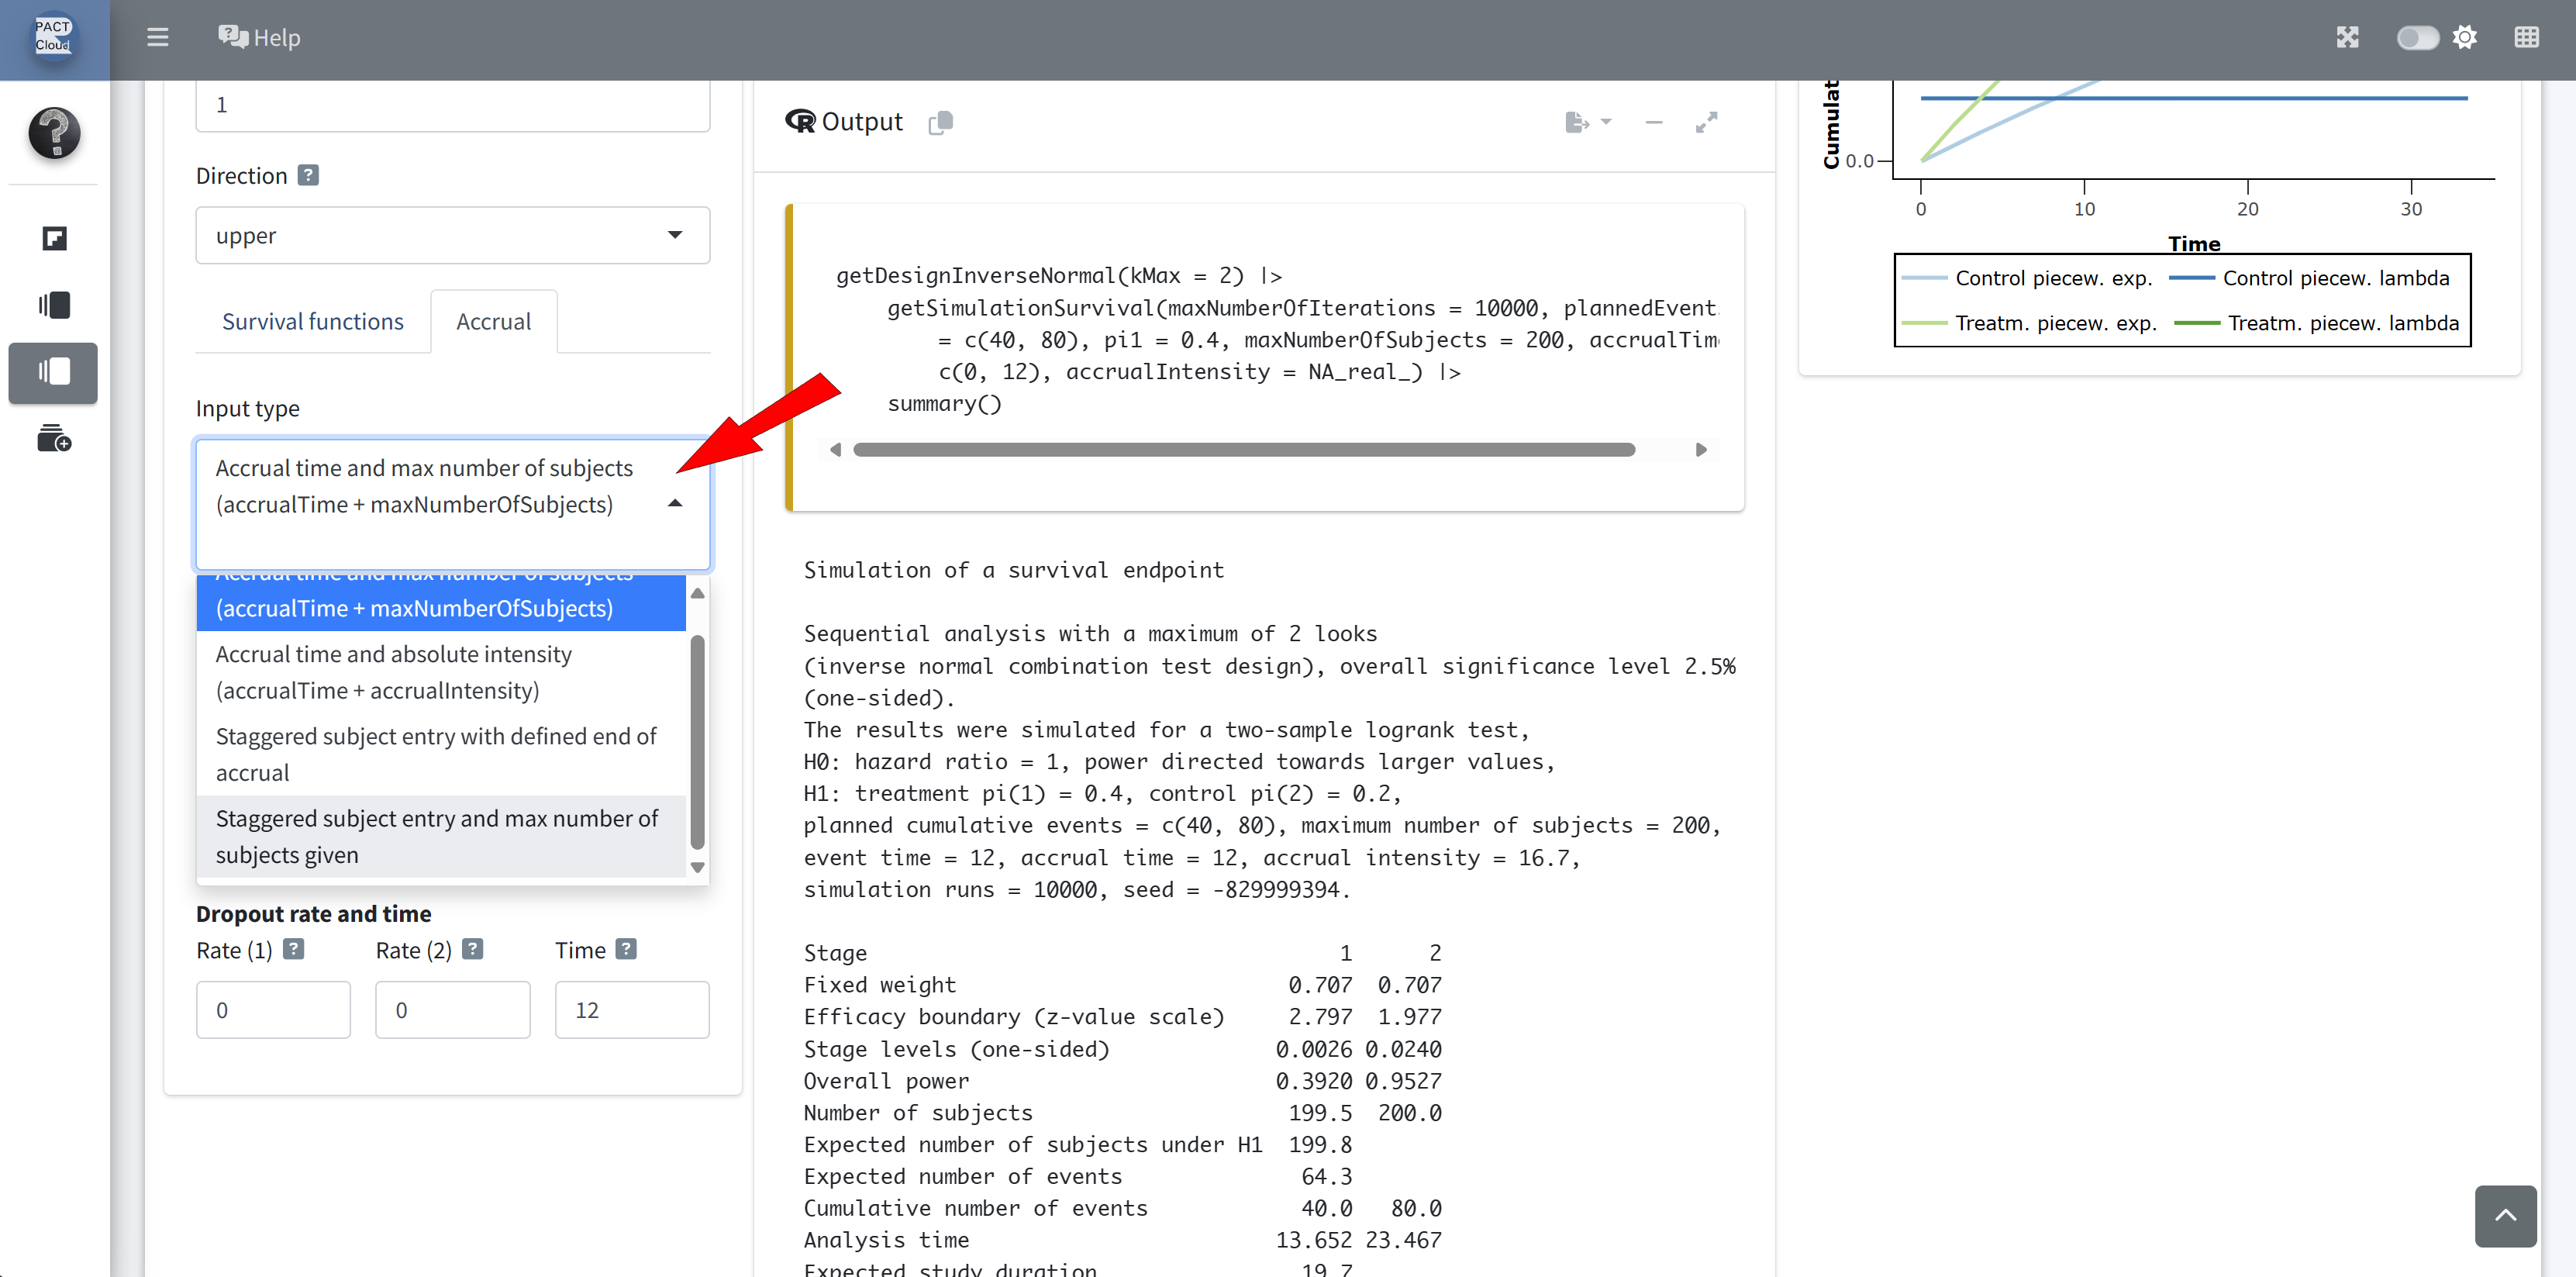
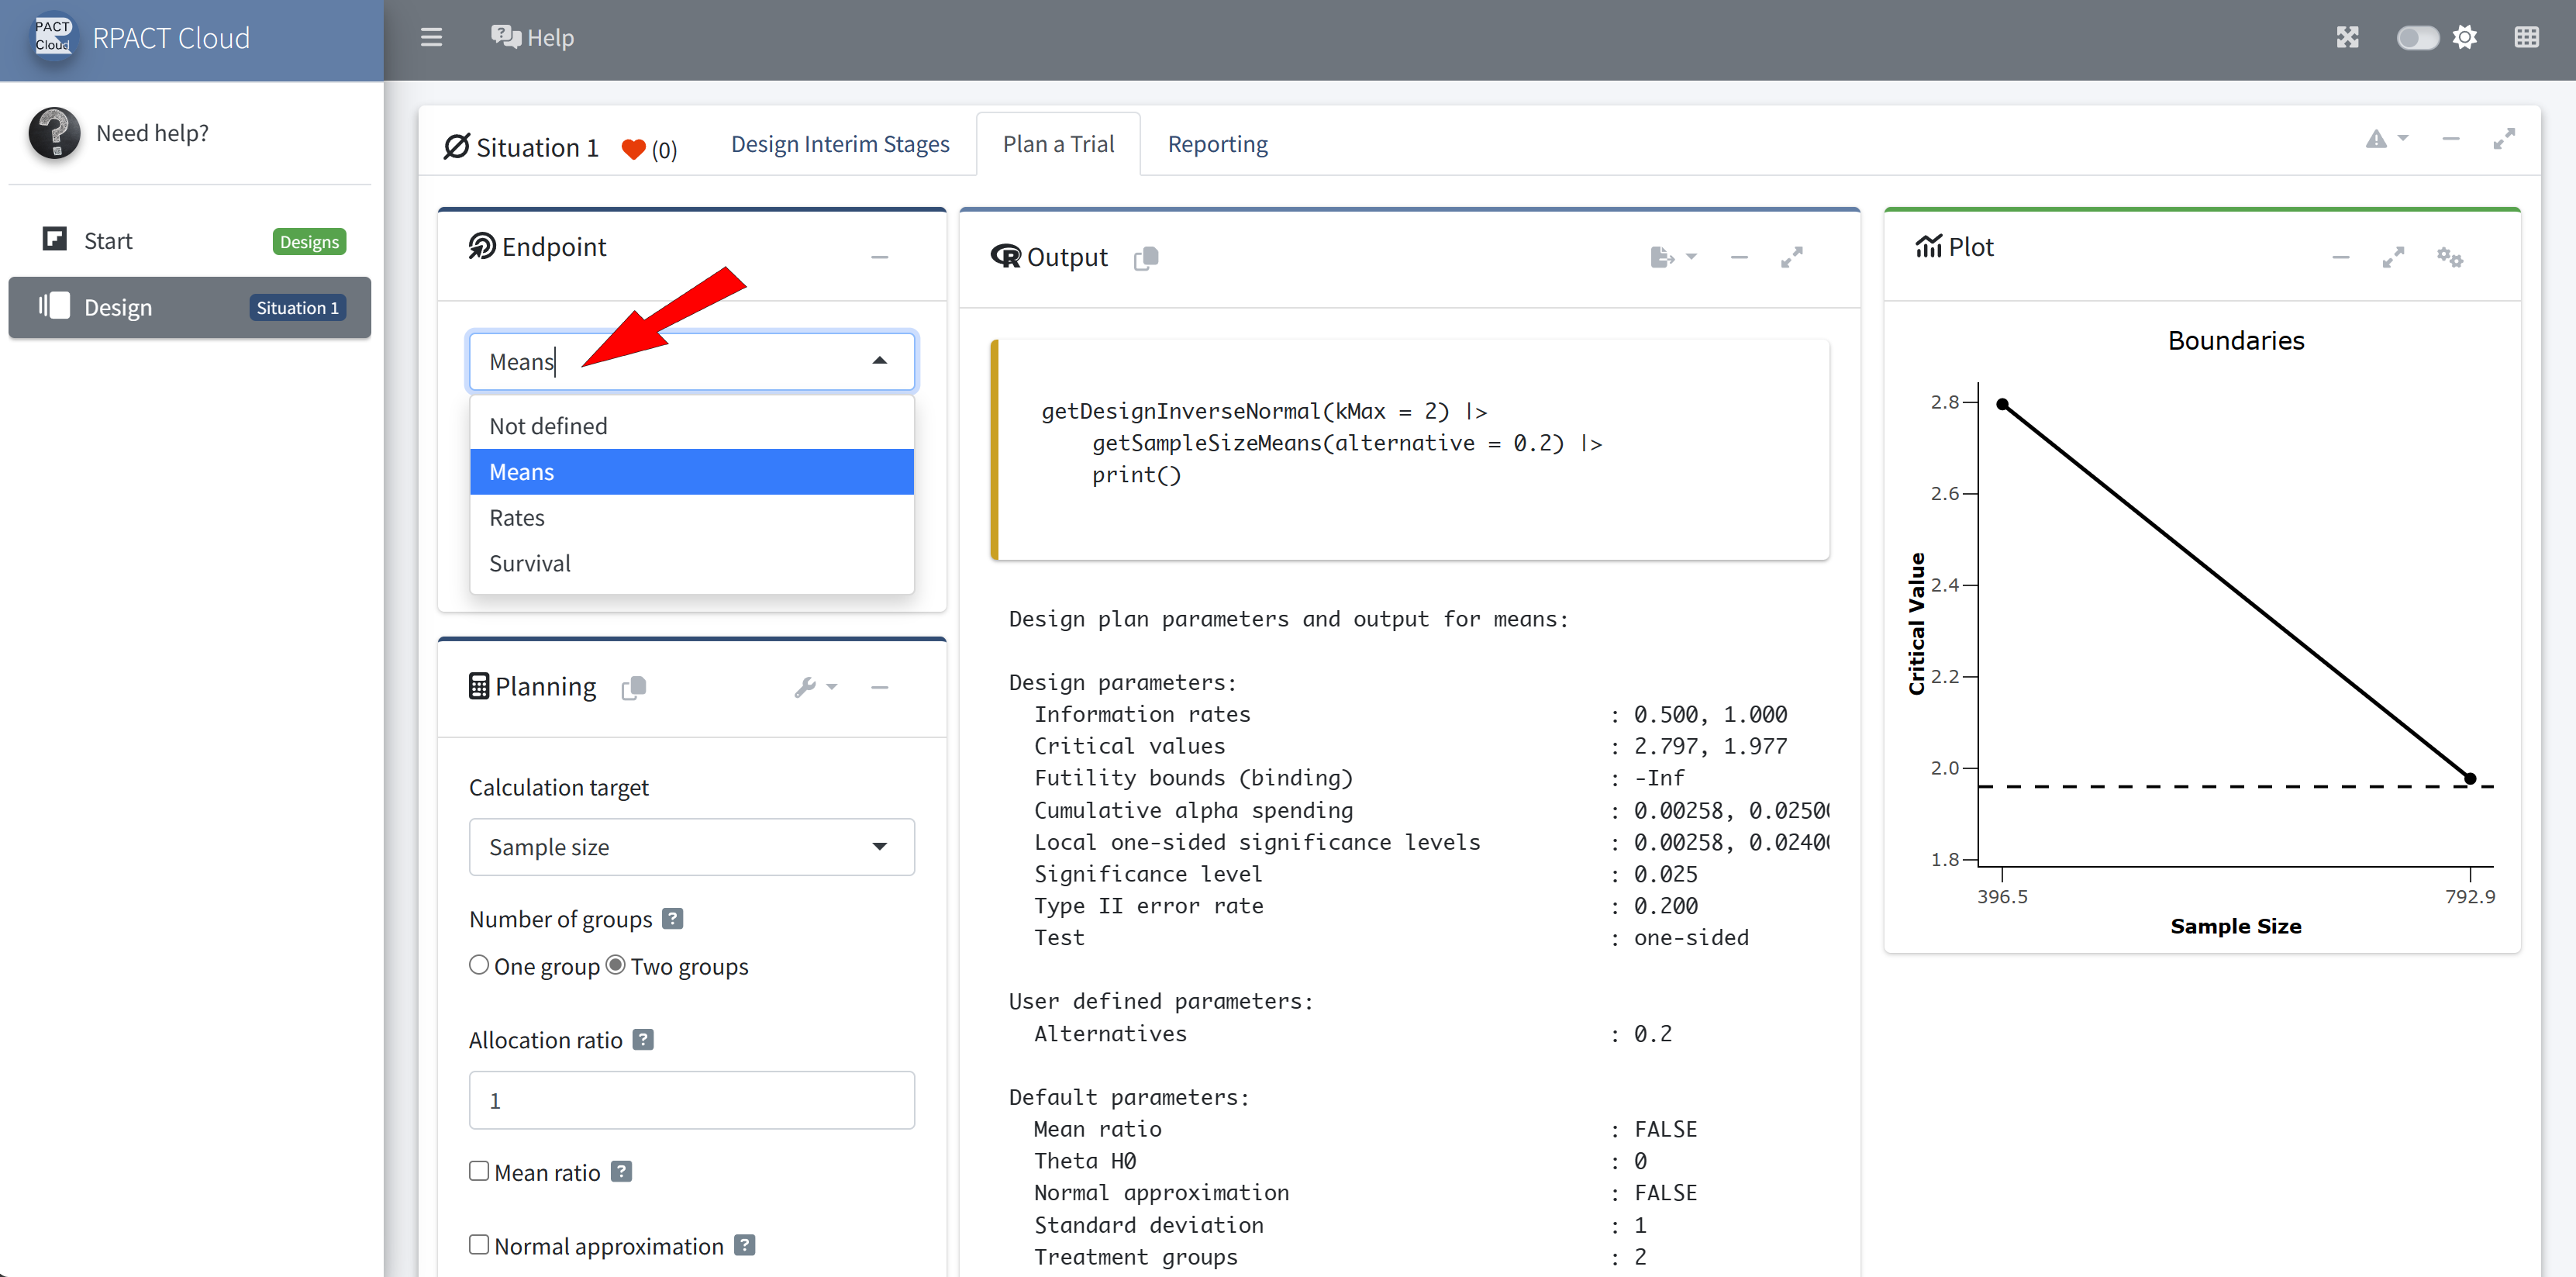
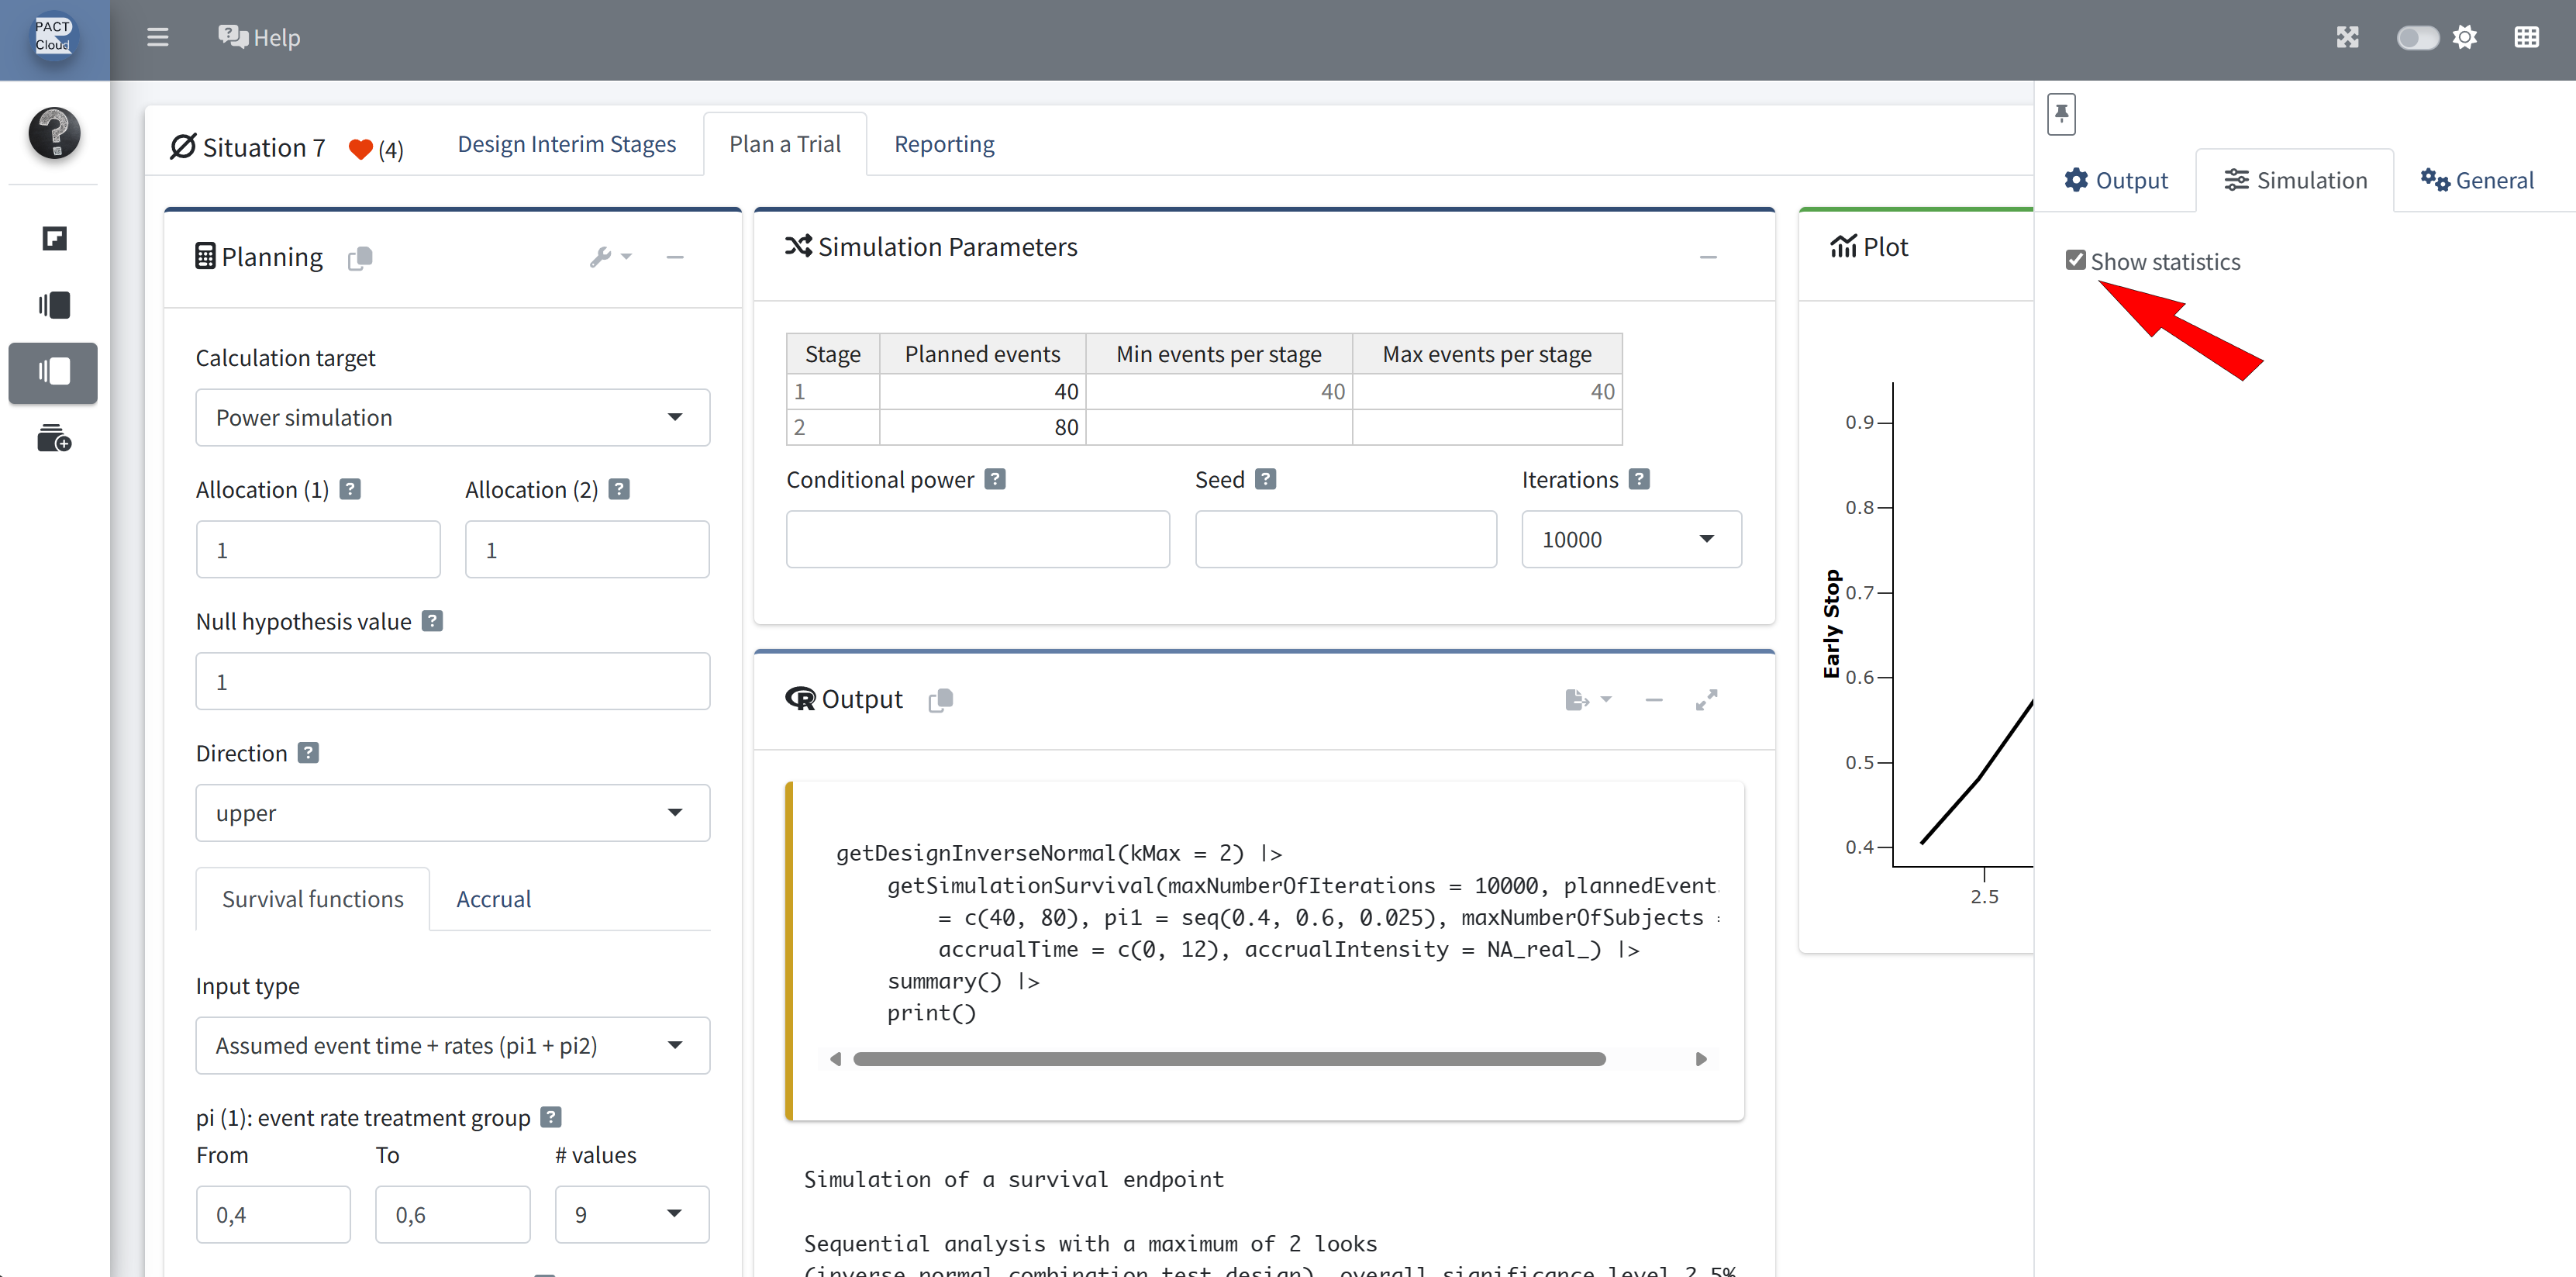
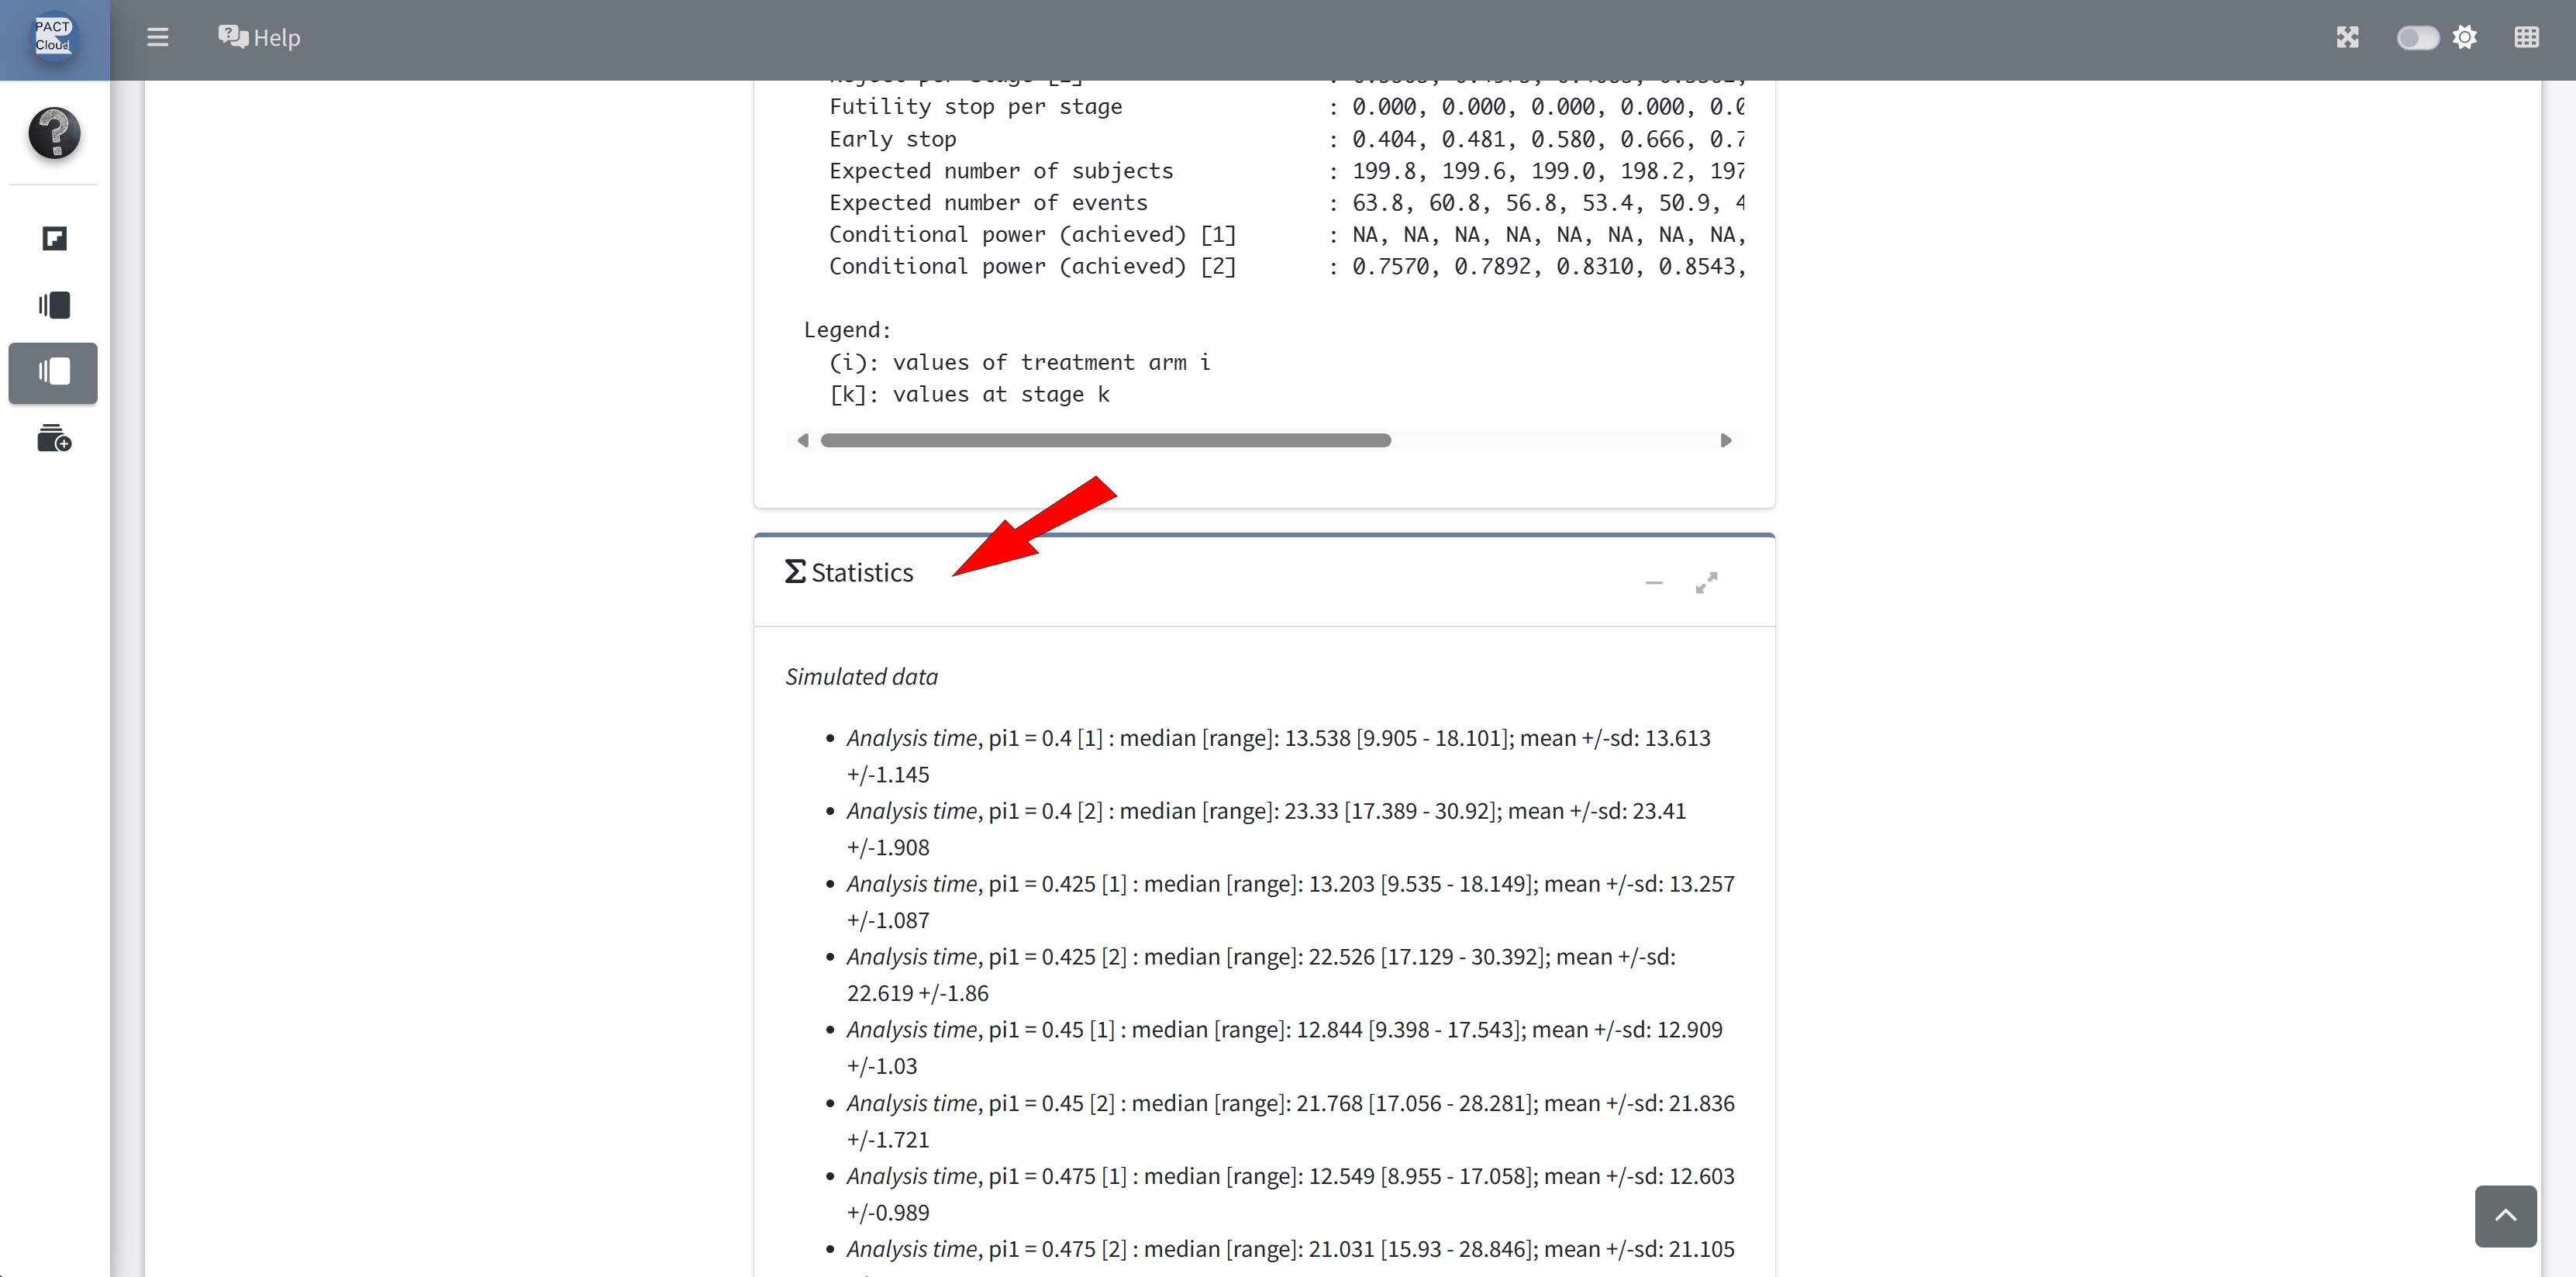
RPACT Cloud – Explore Parameter Levels
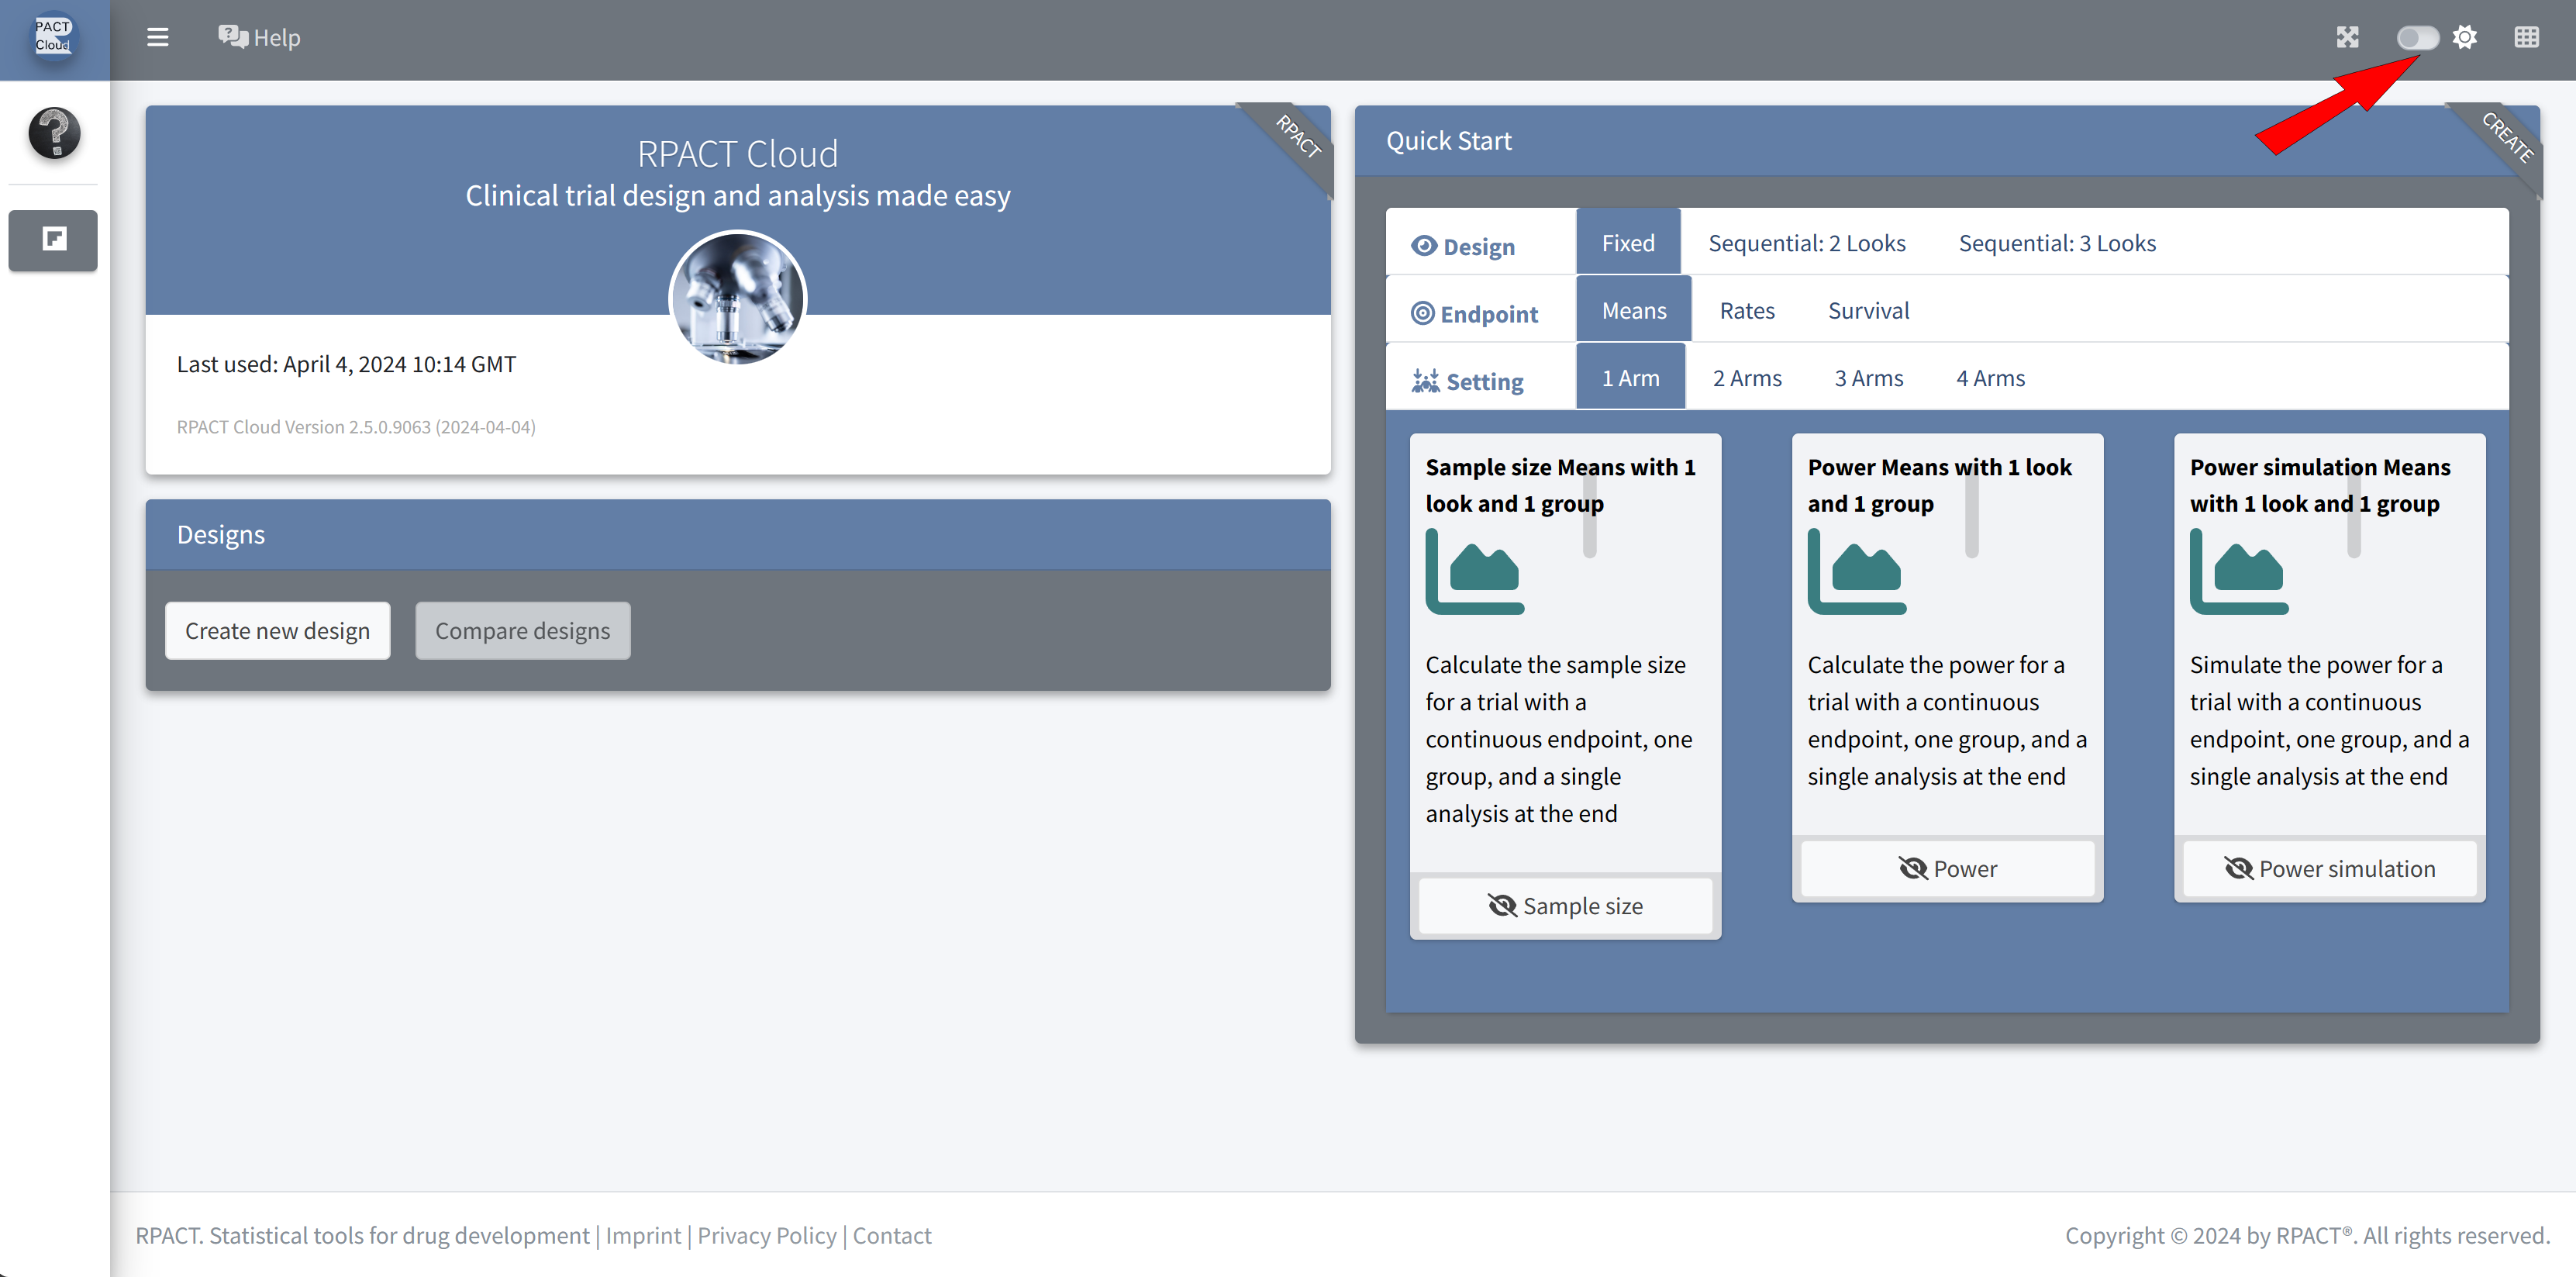
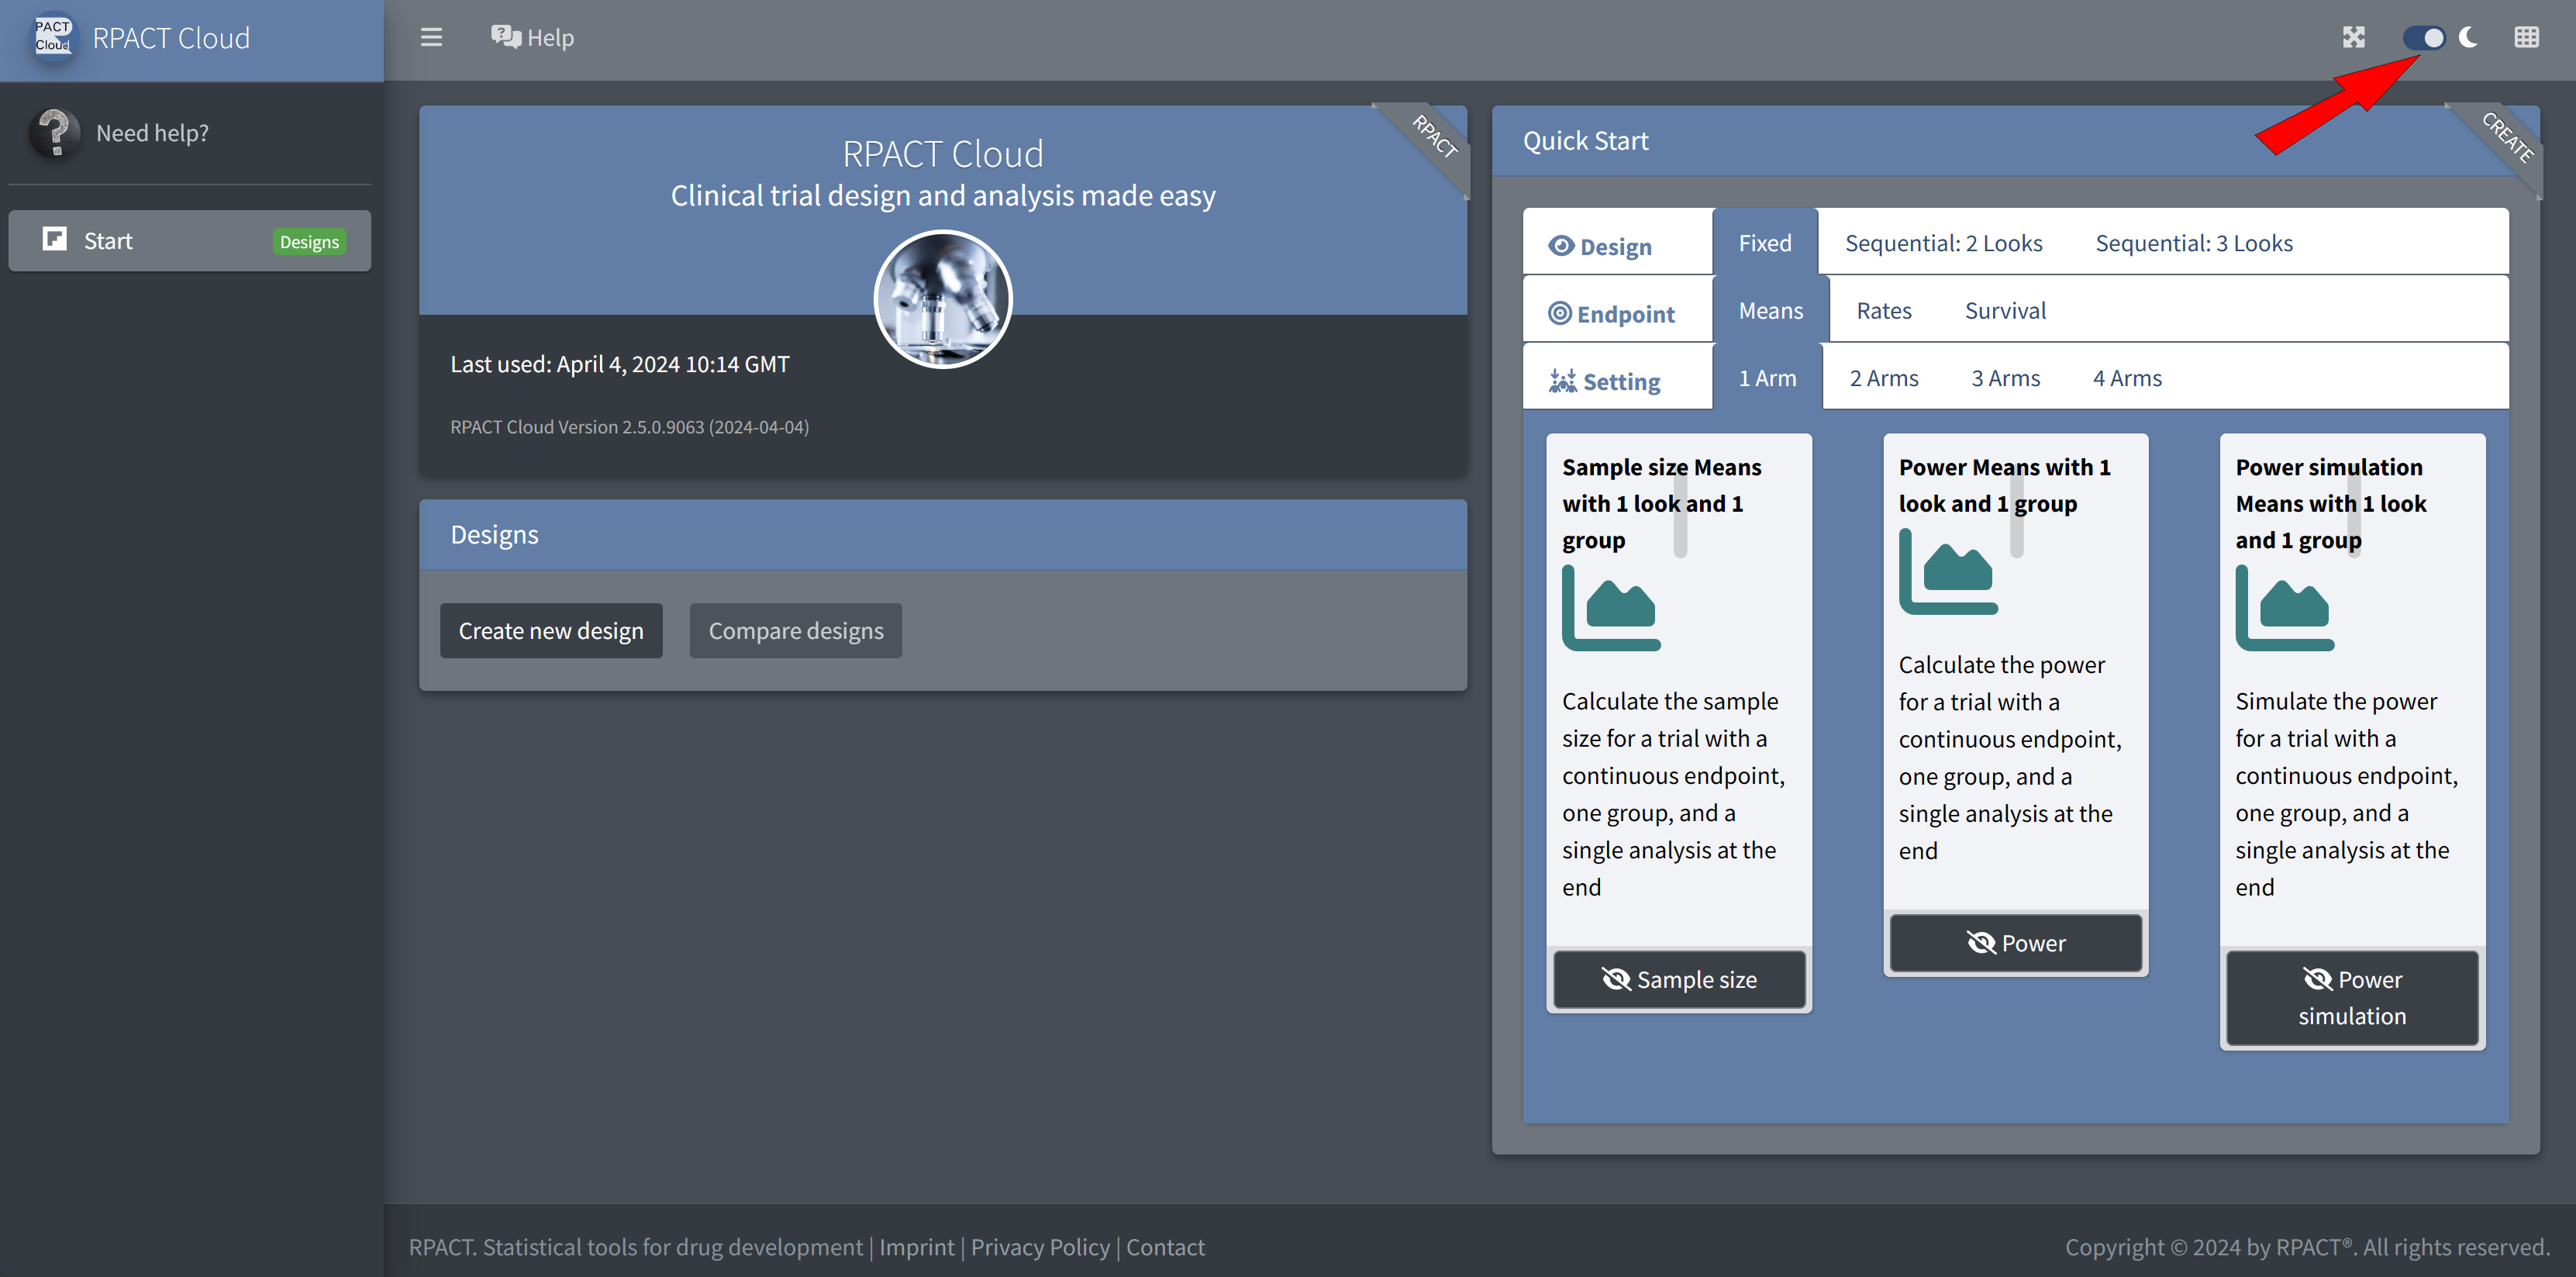
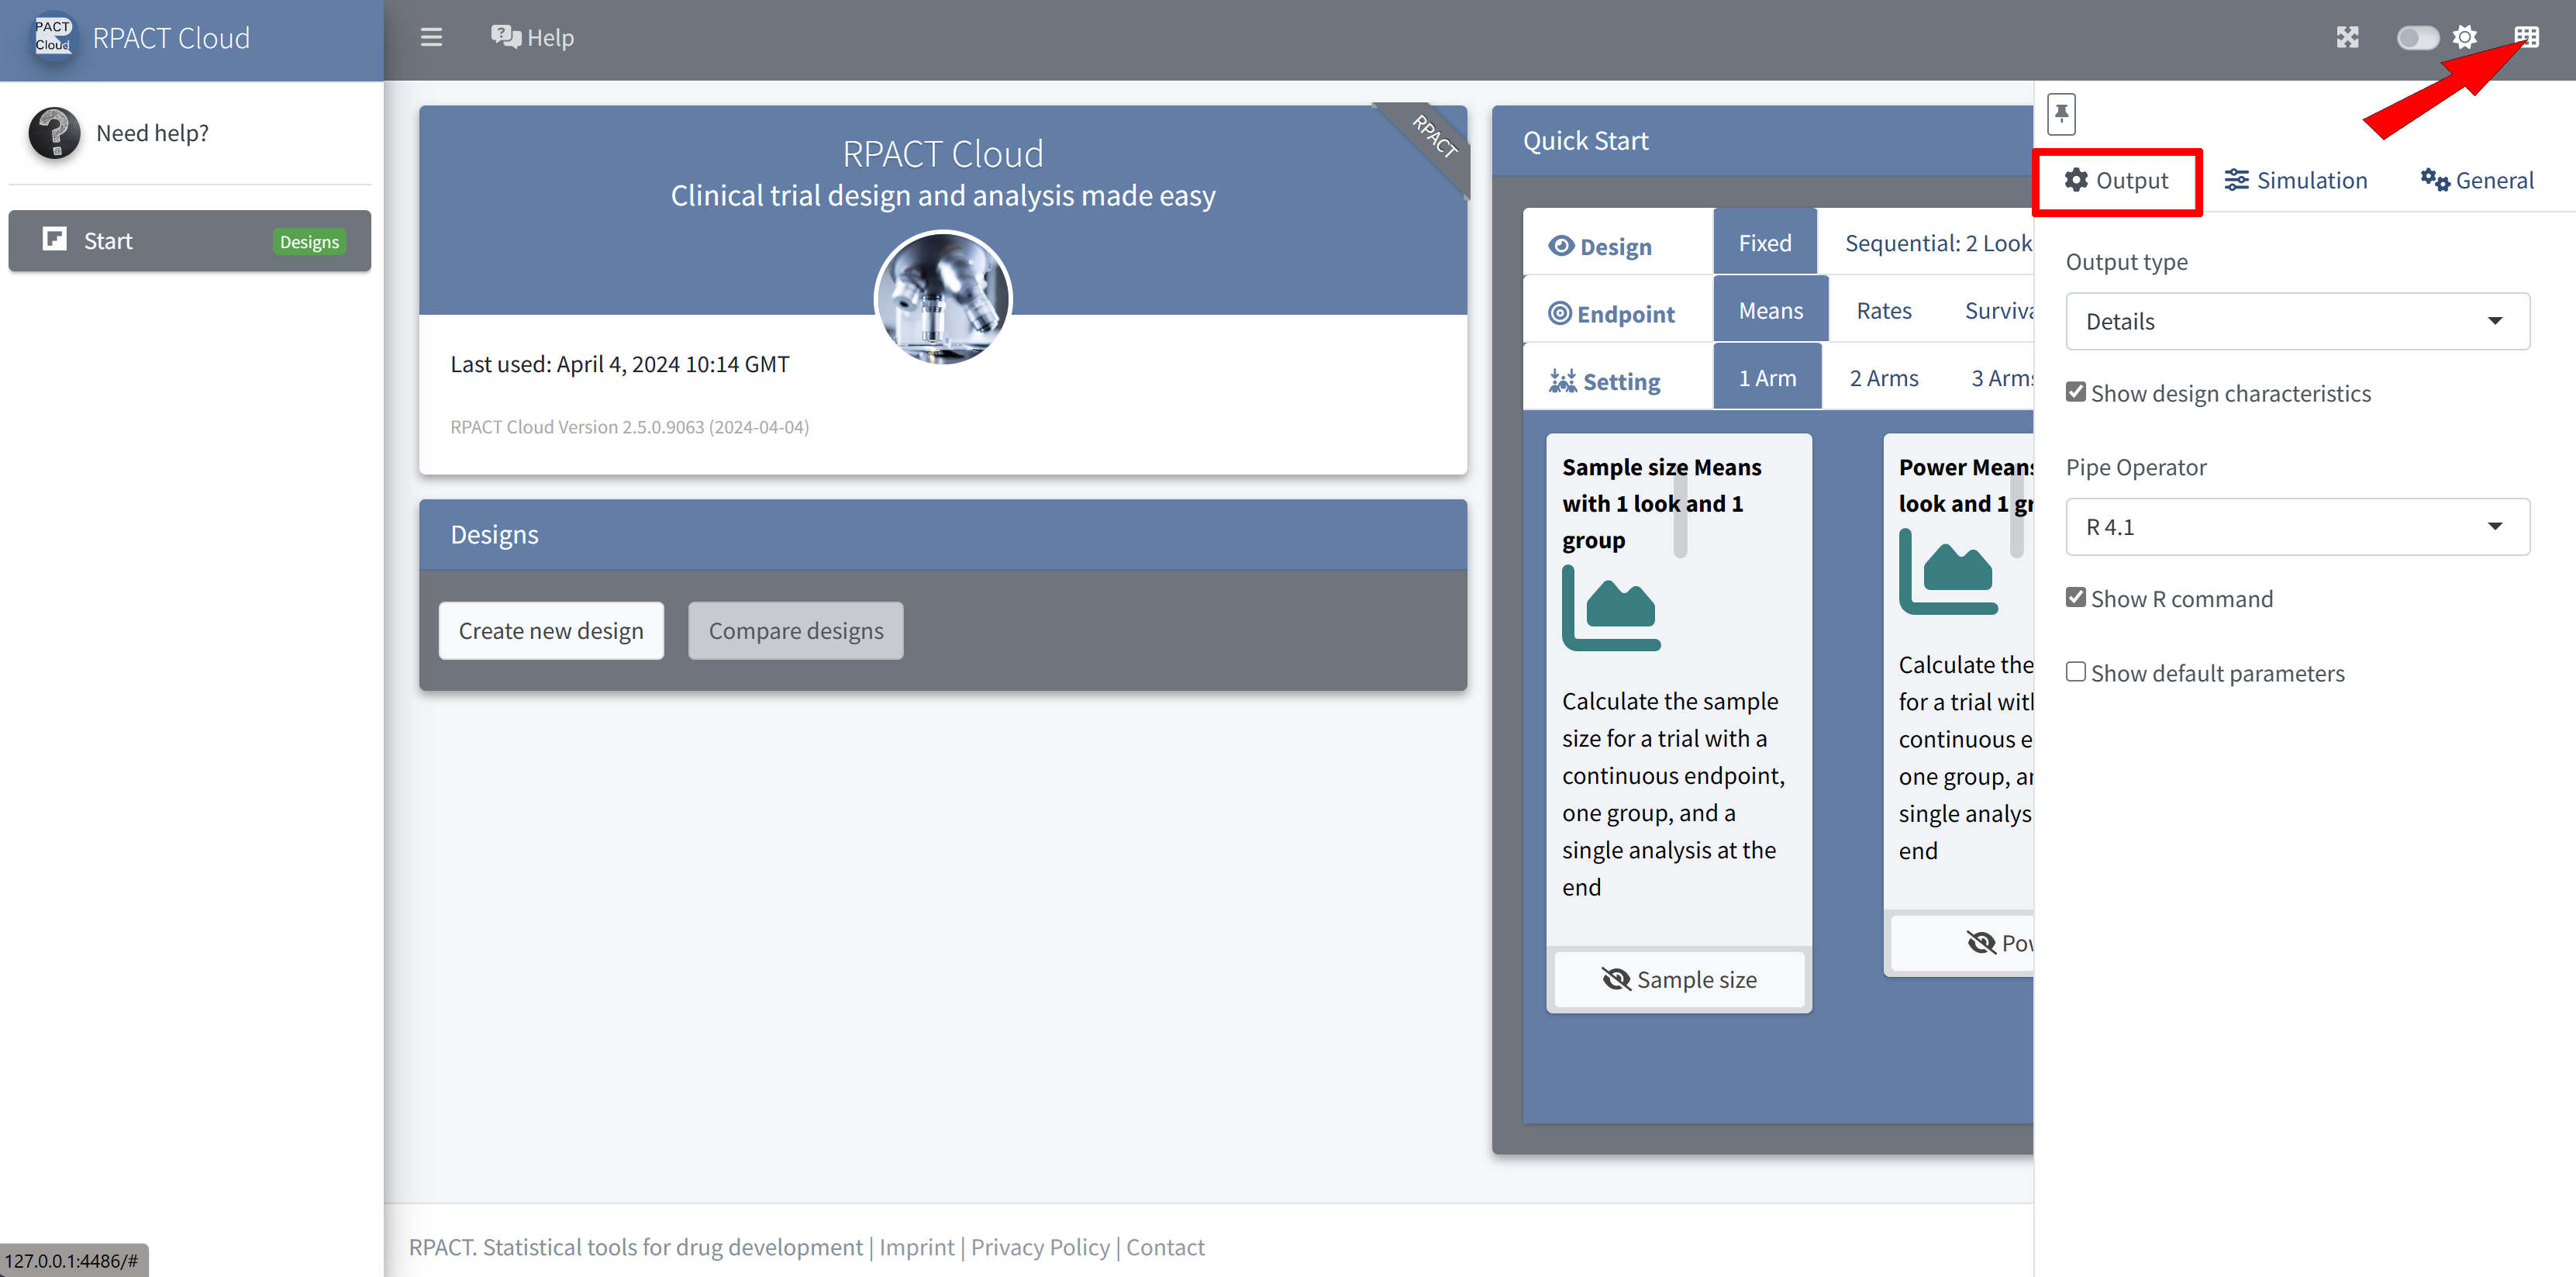
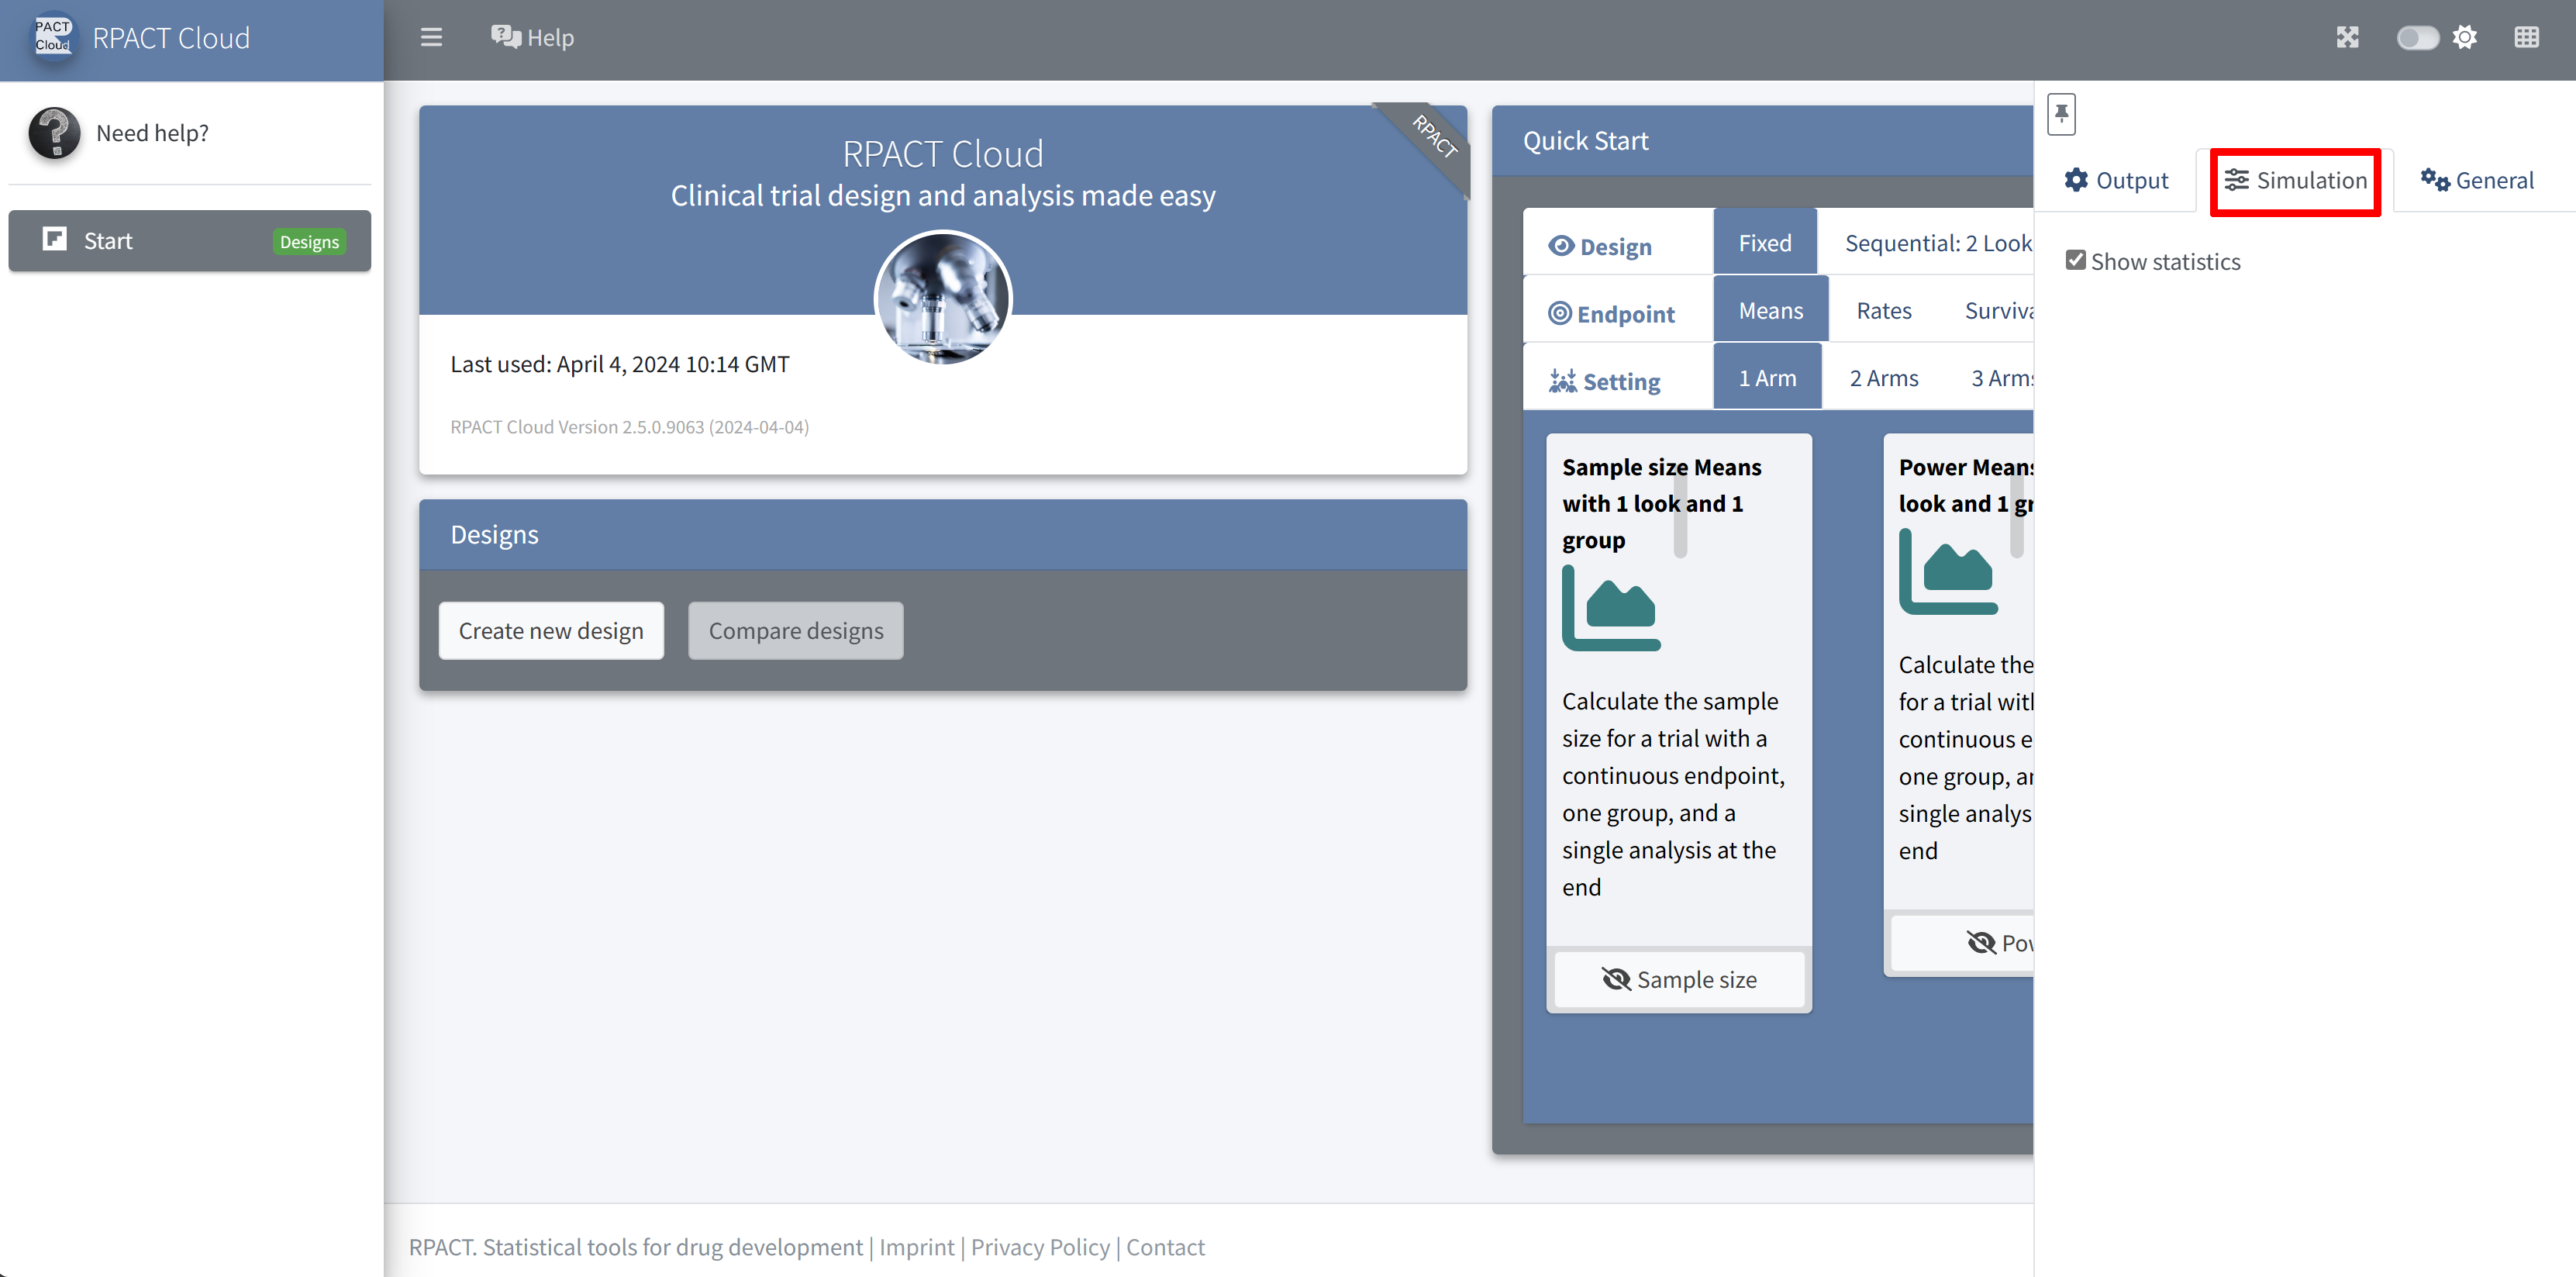
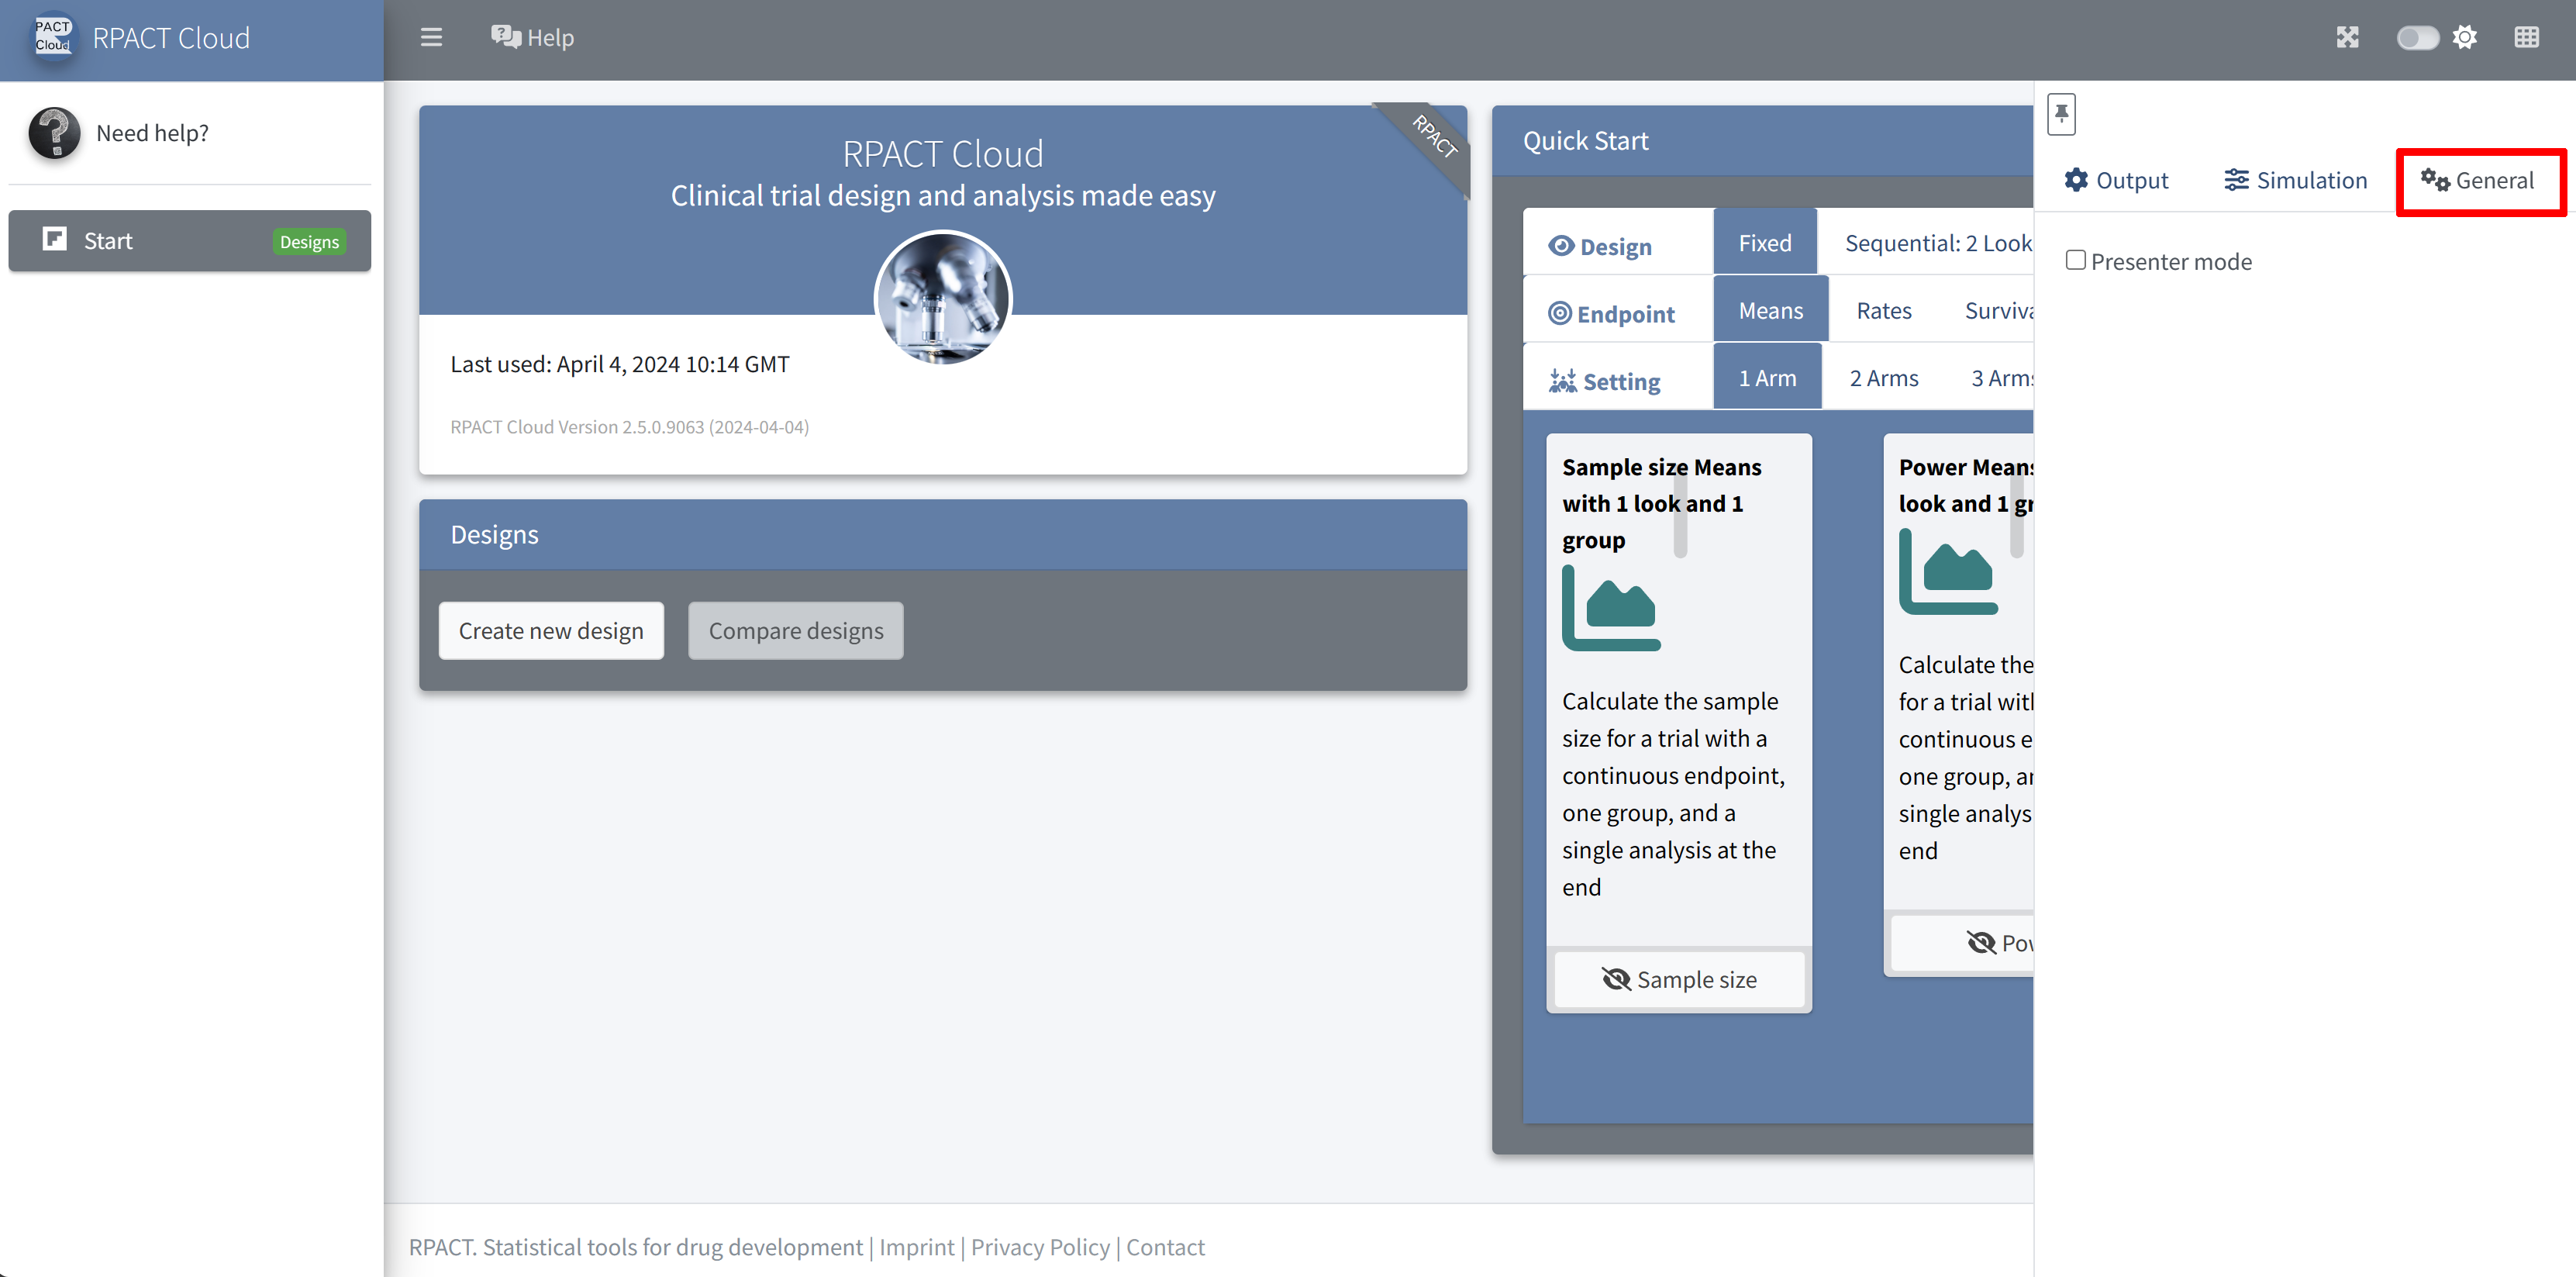
RPACT Cloud – Settings
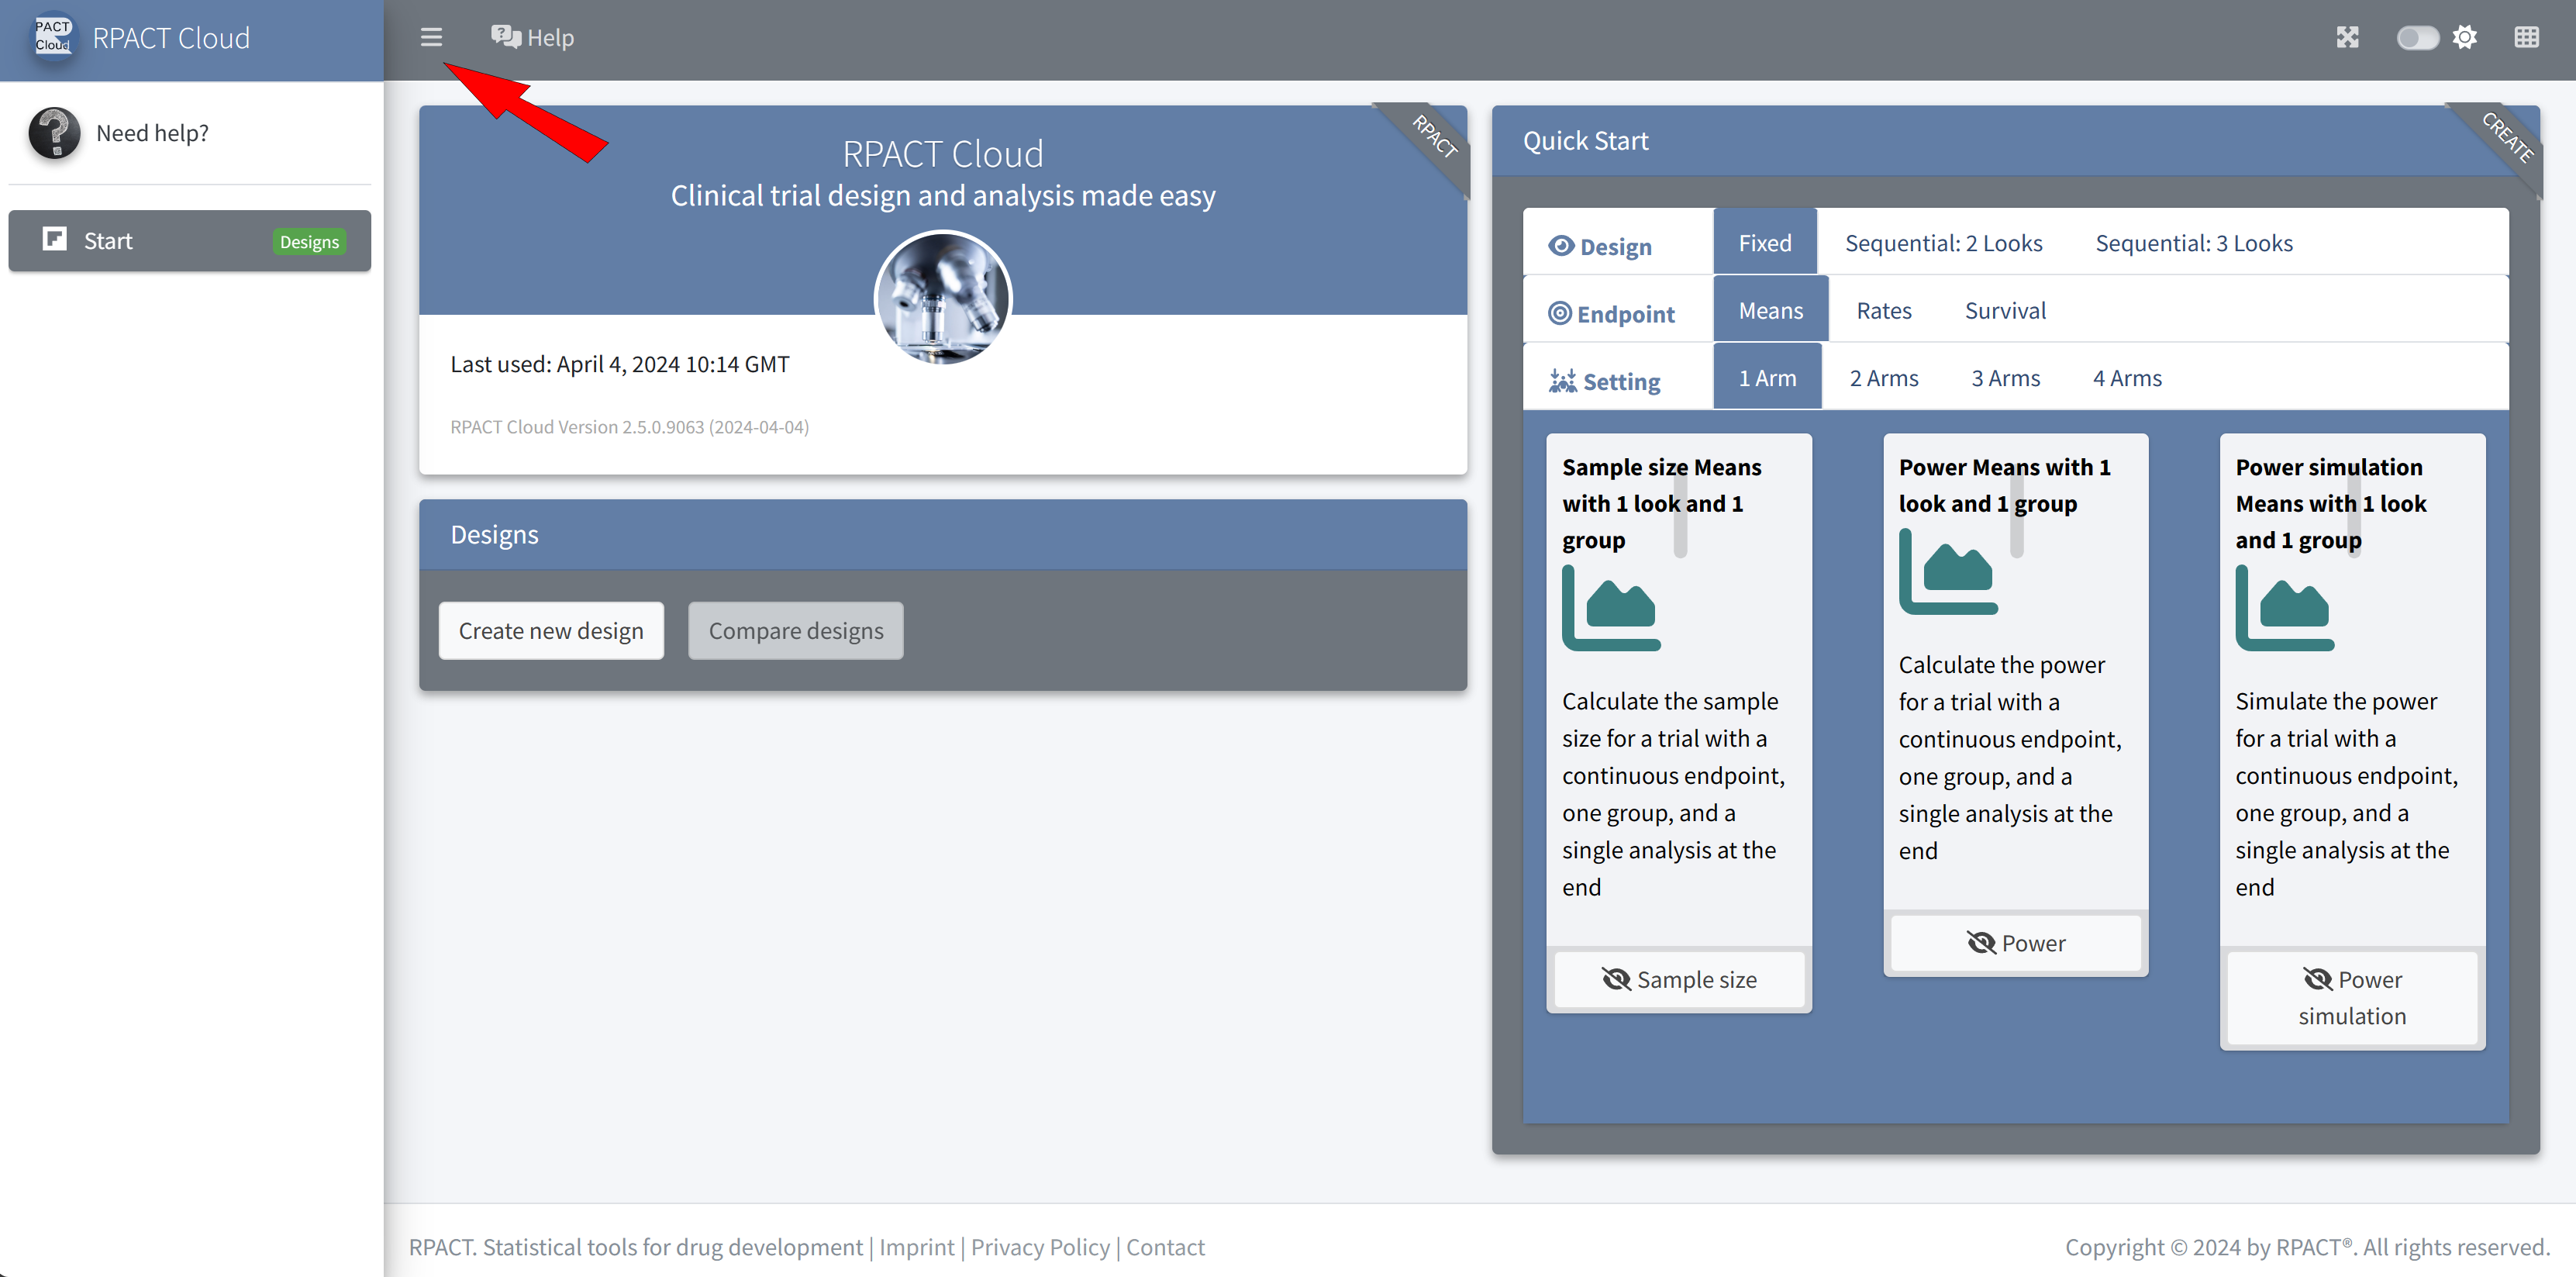
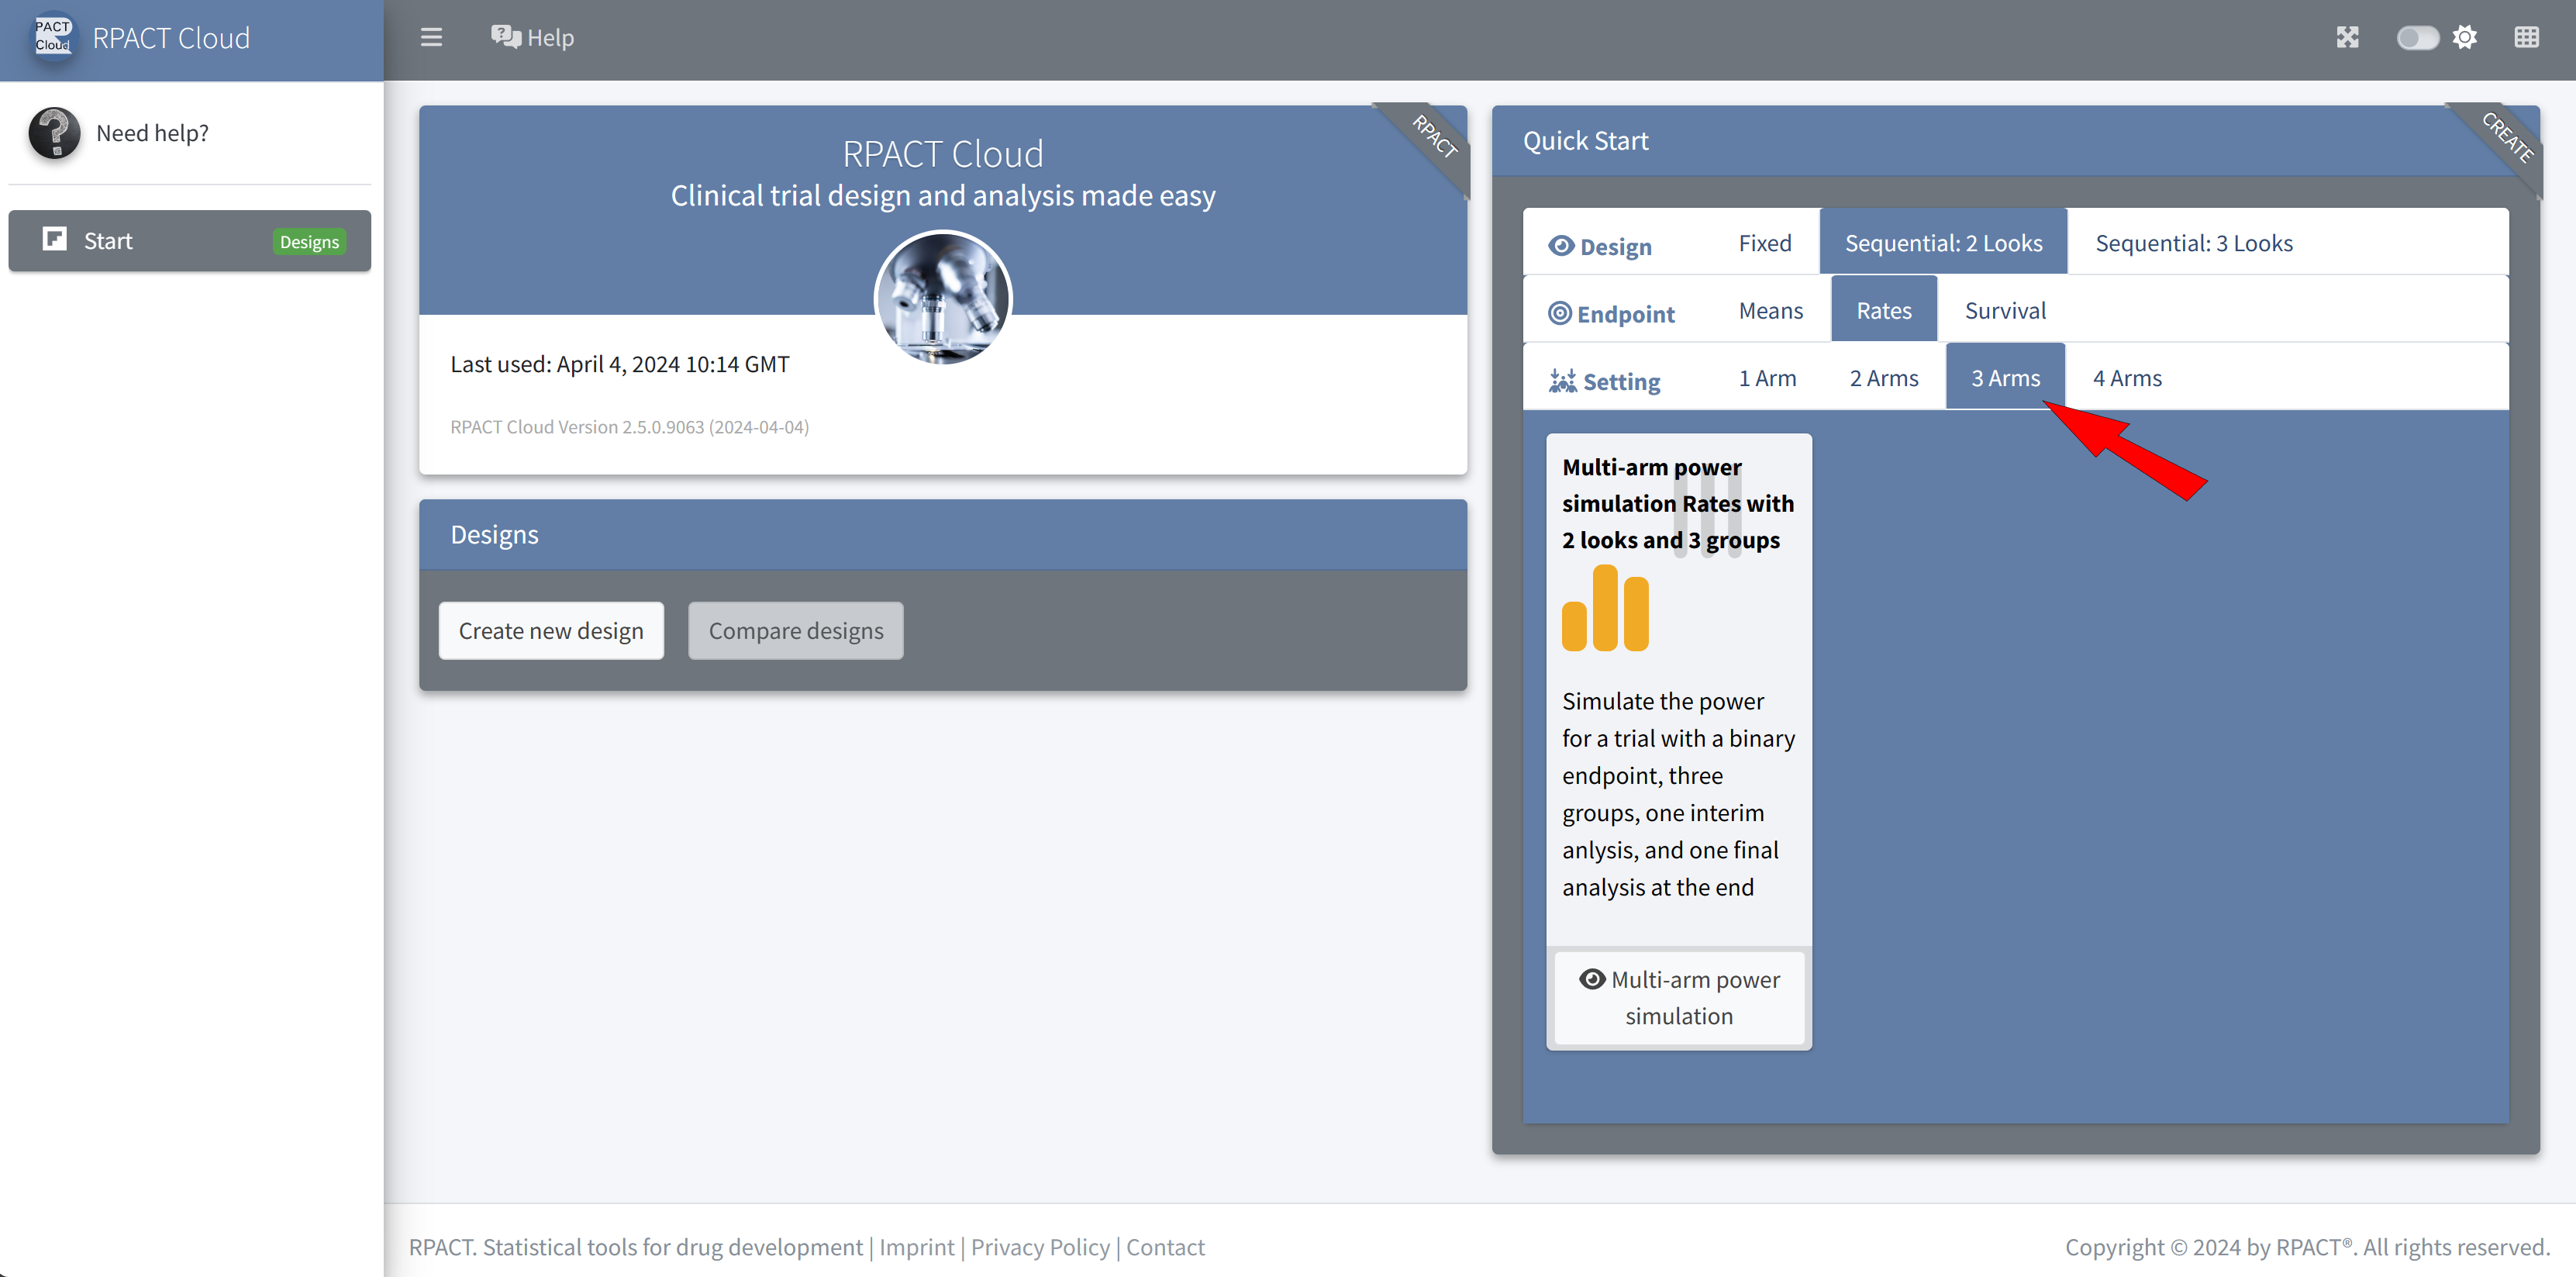
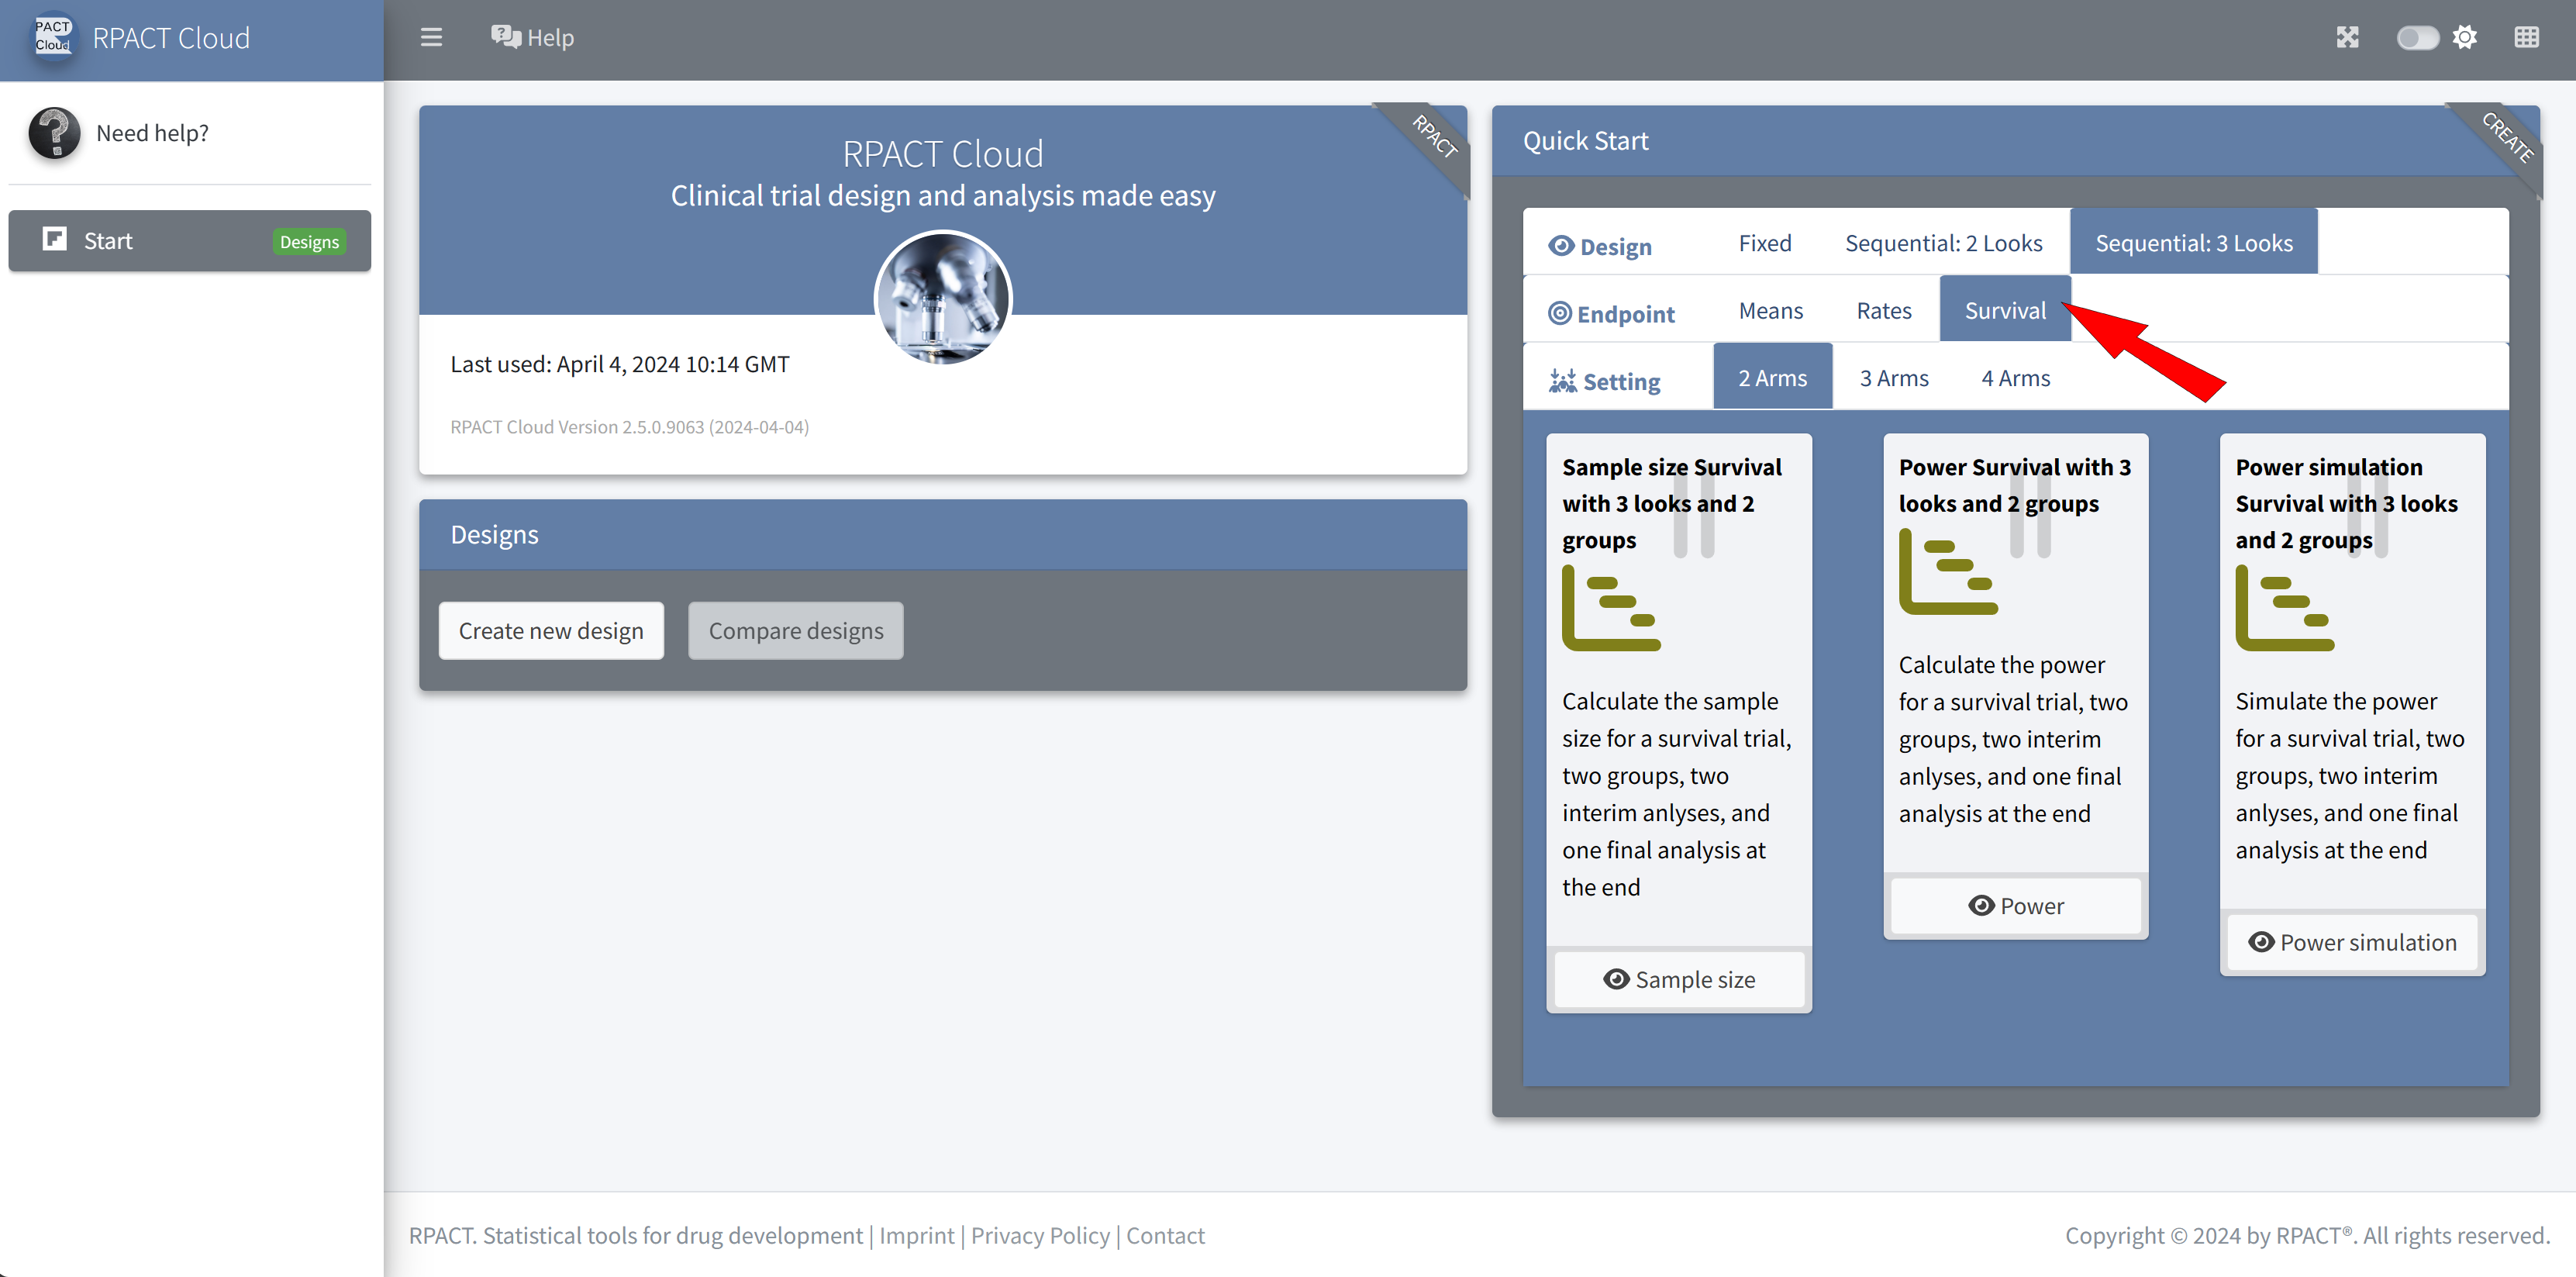
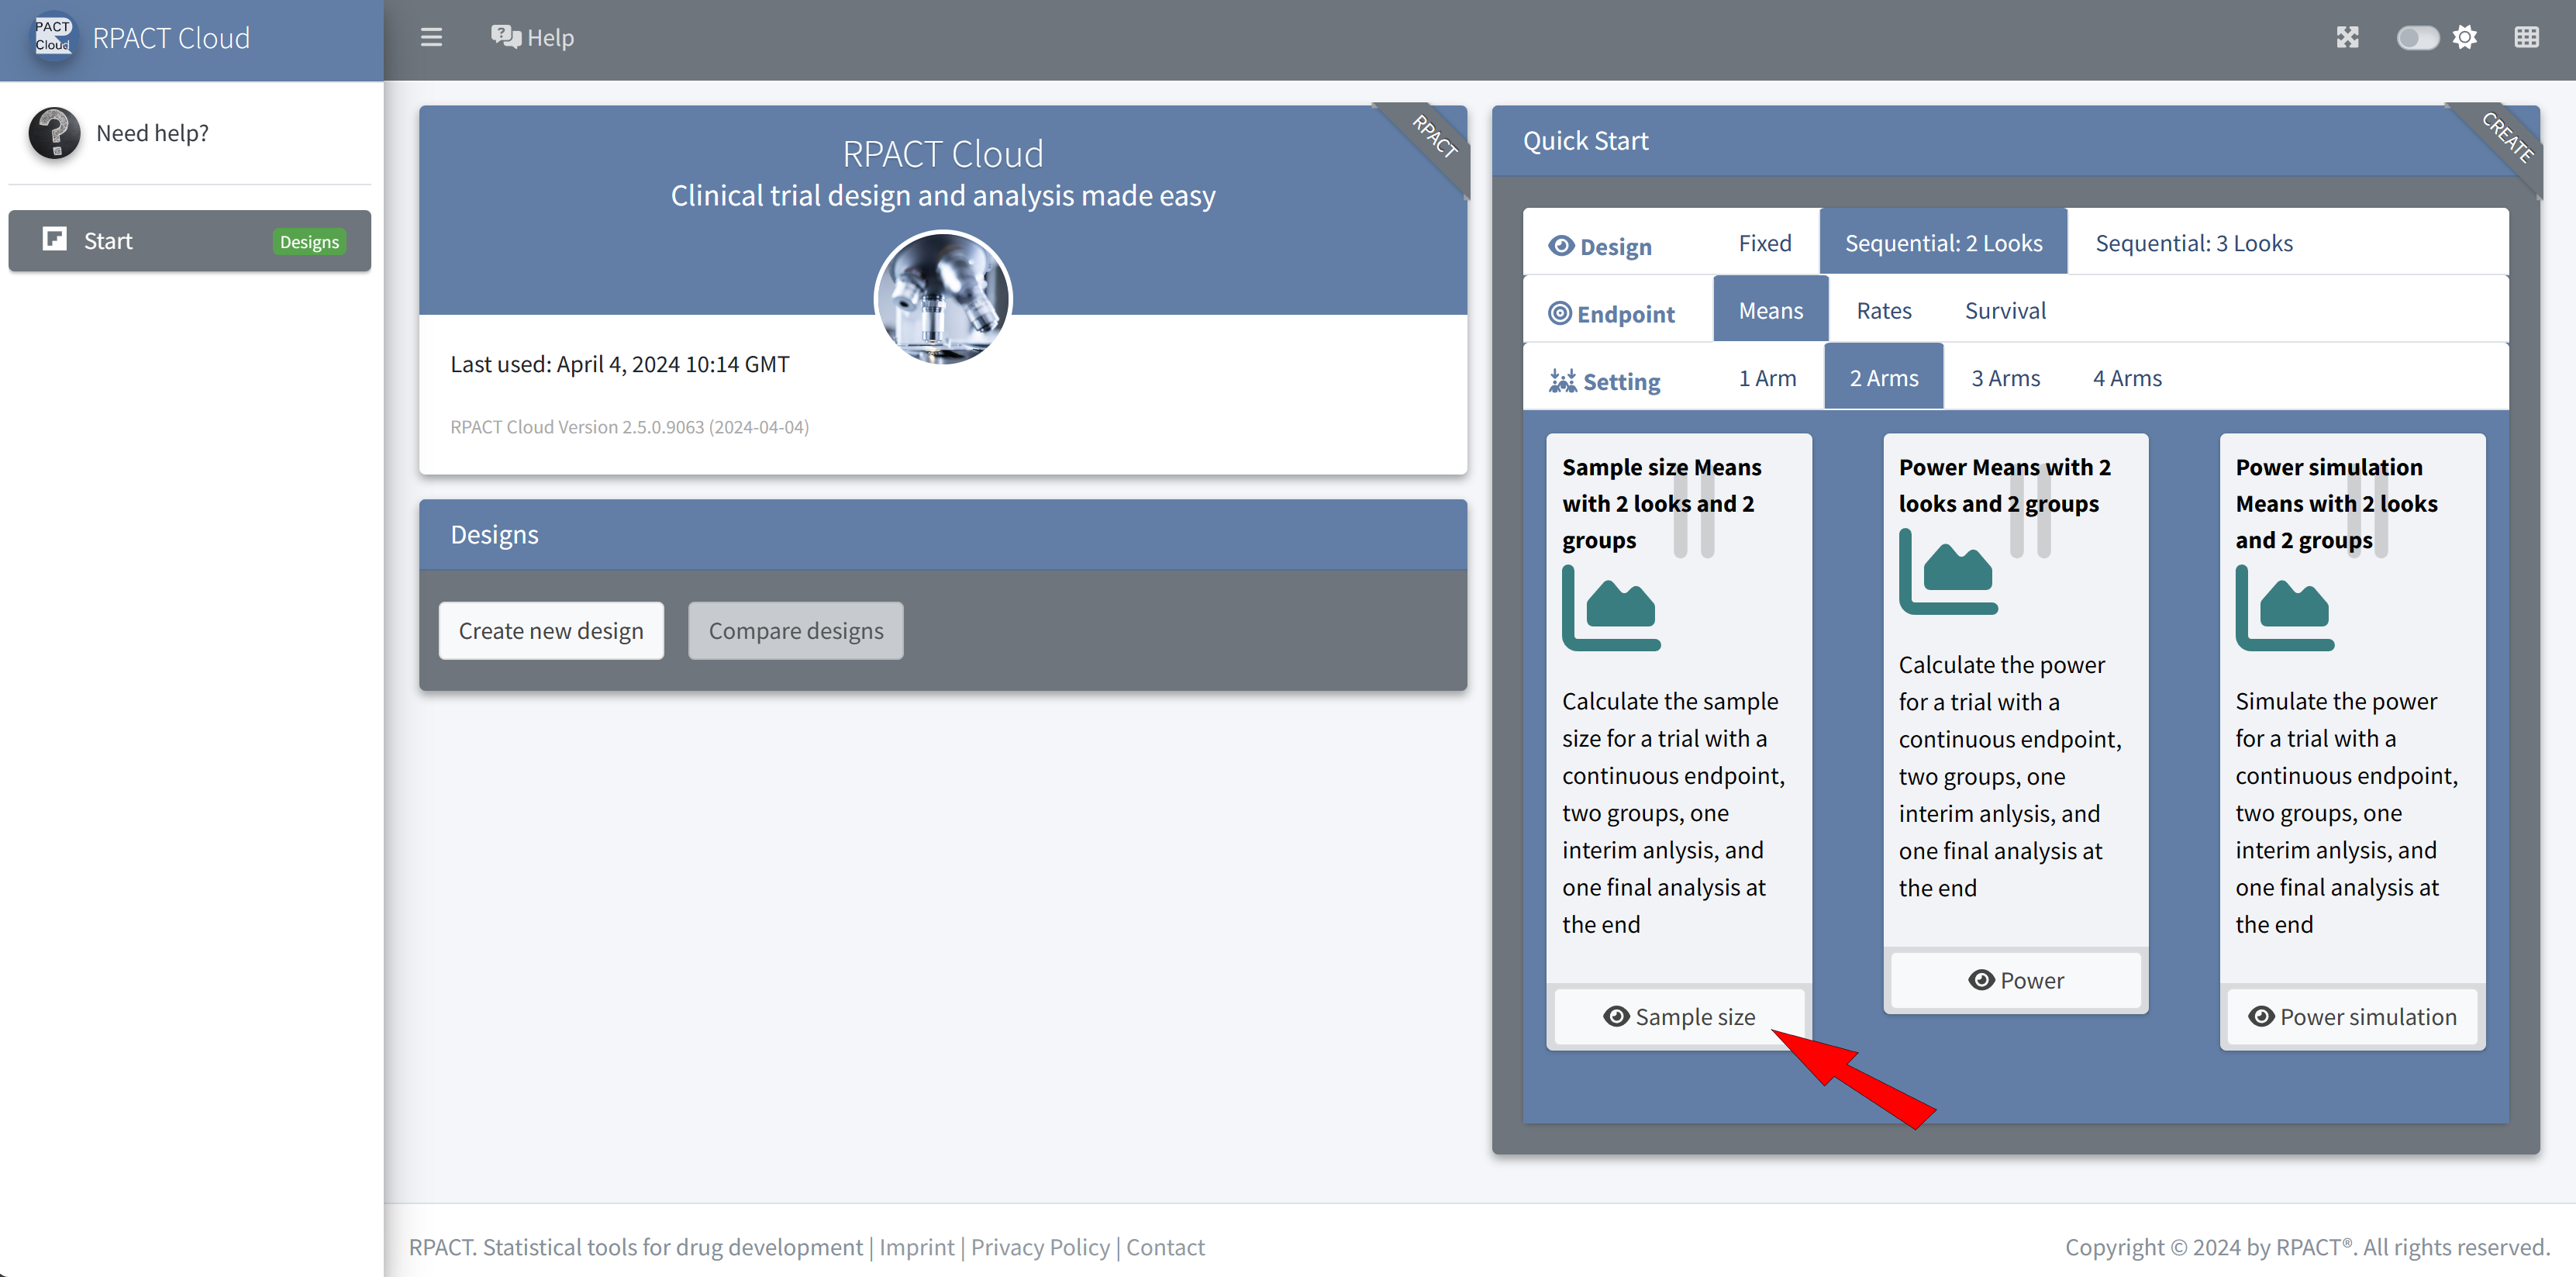
RPACT Cloud – Quick Start Menu

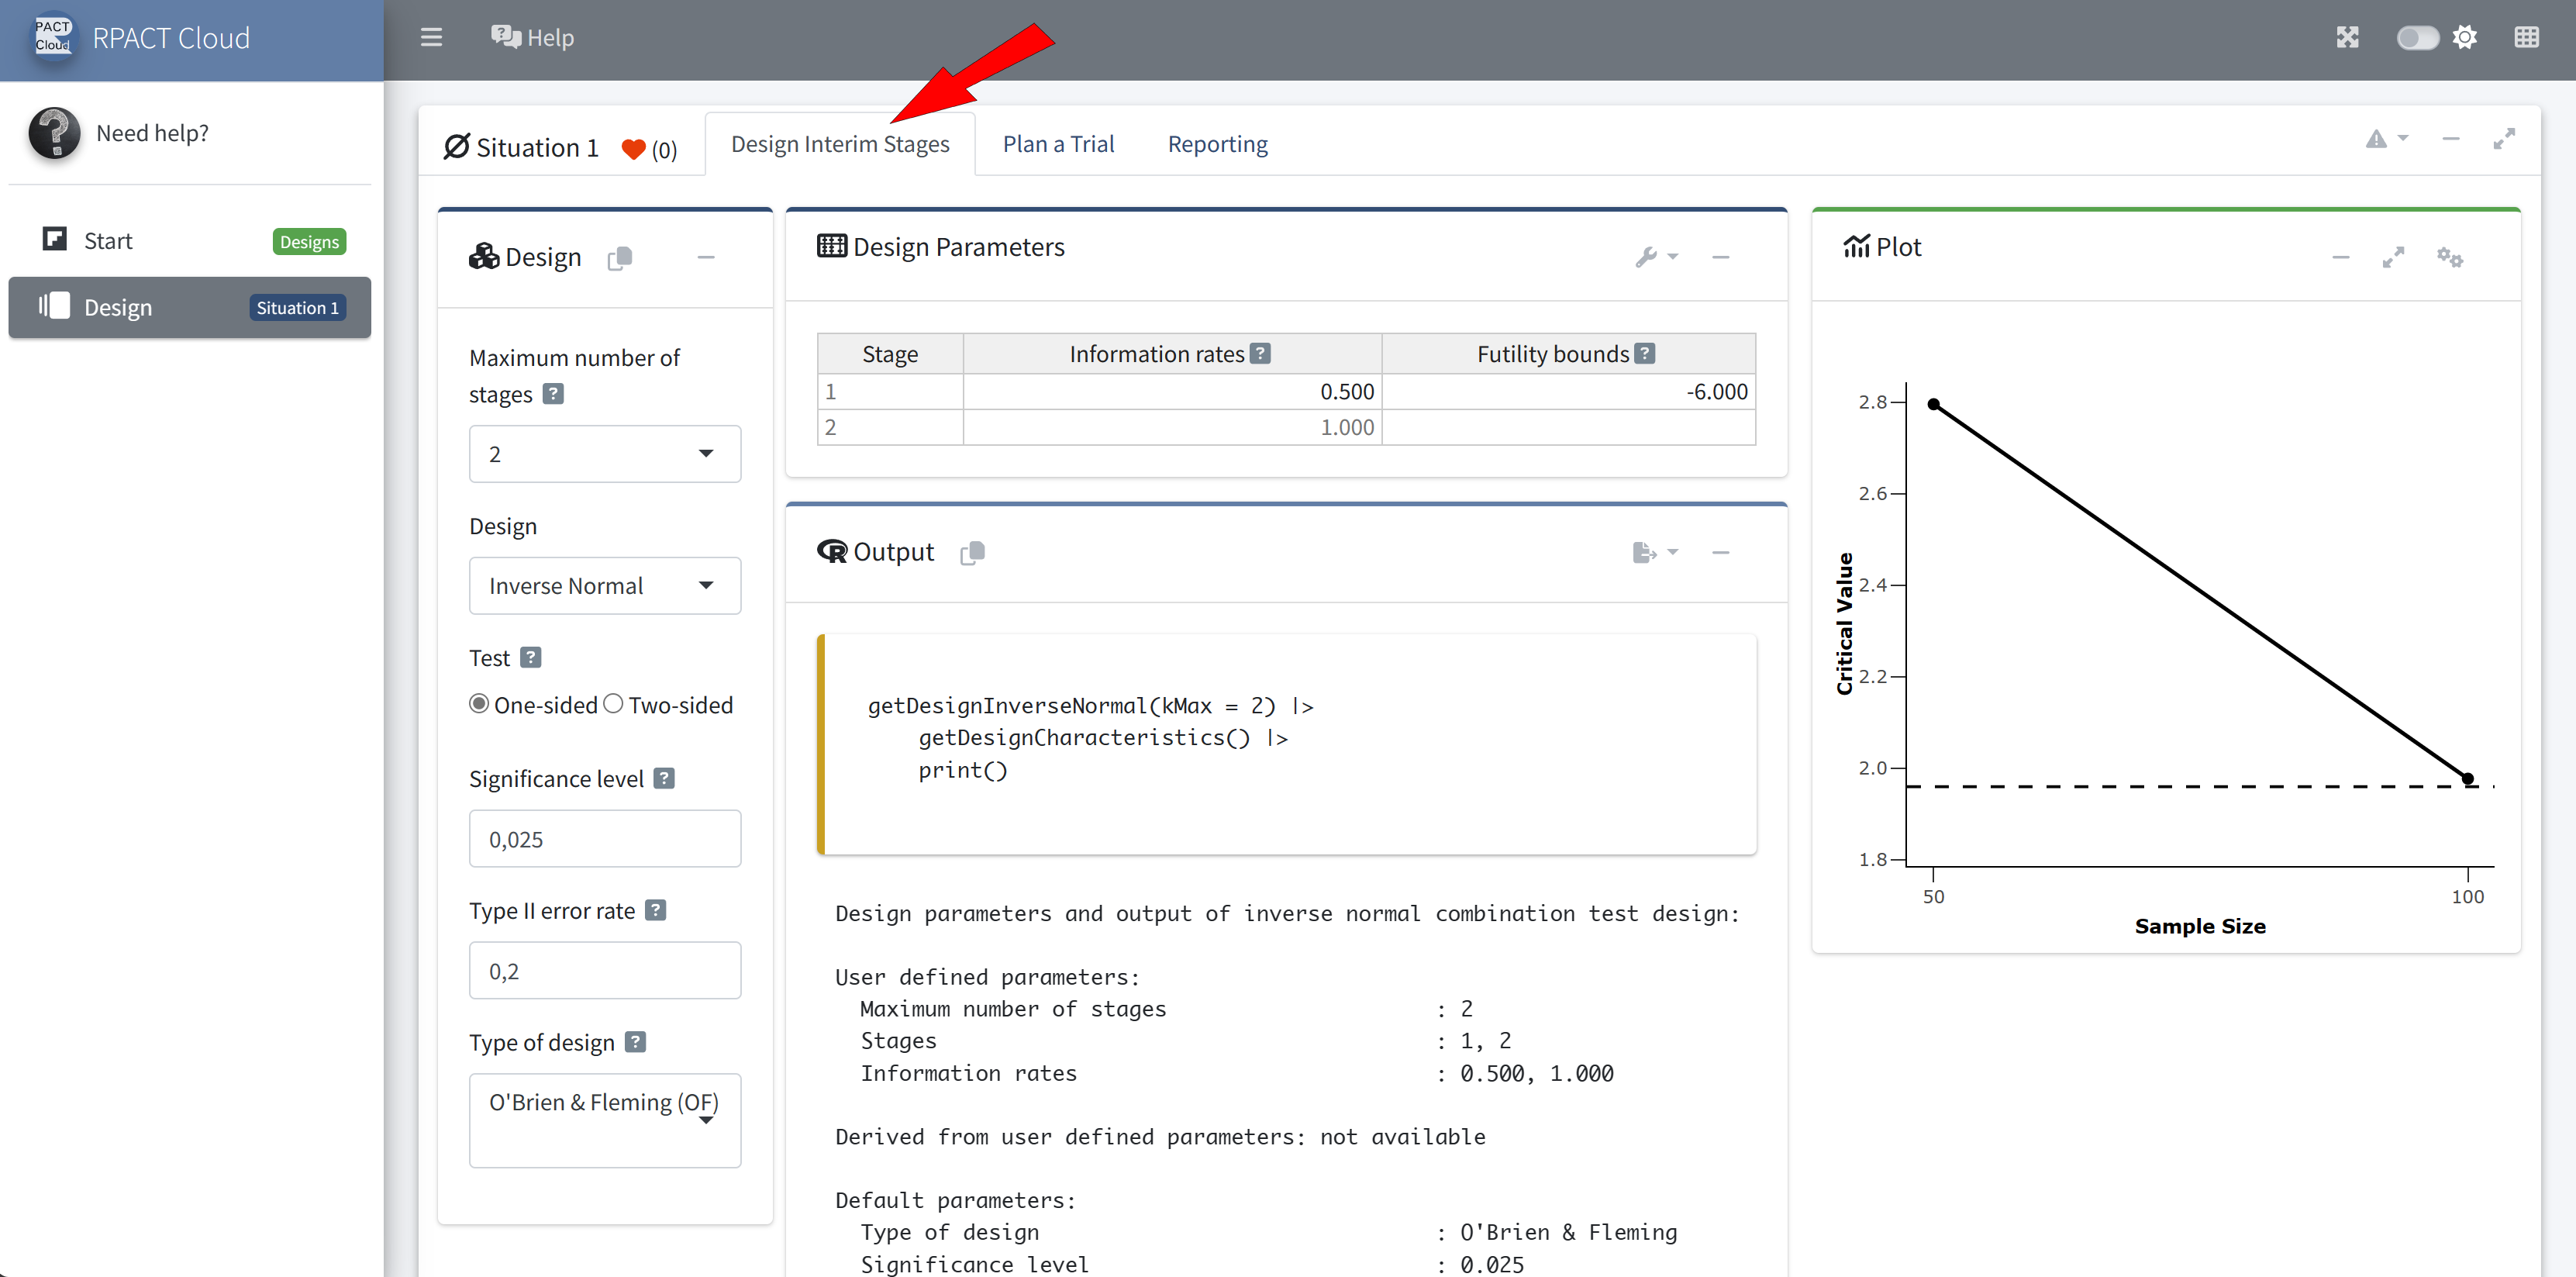
RPACT Cloud – Design Tabs
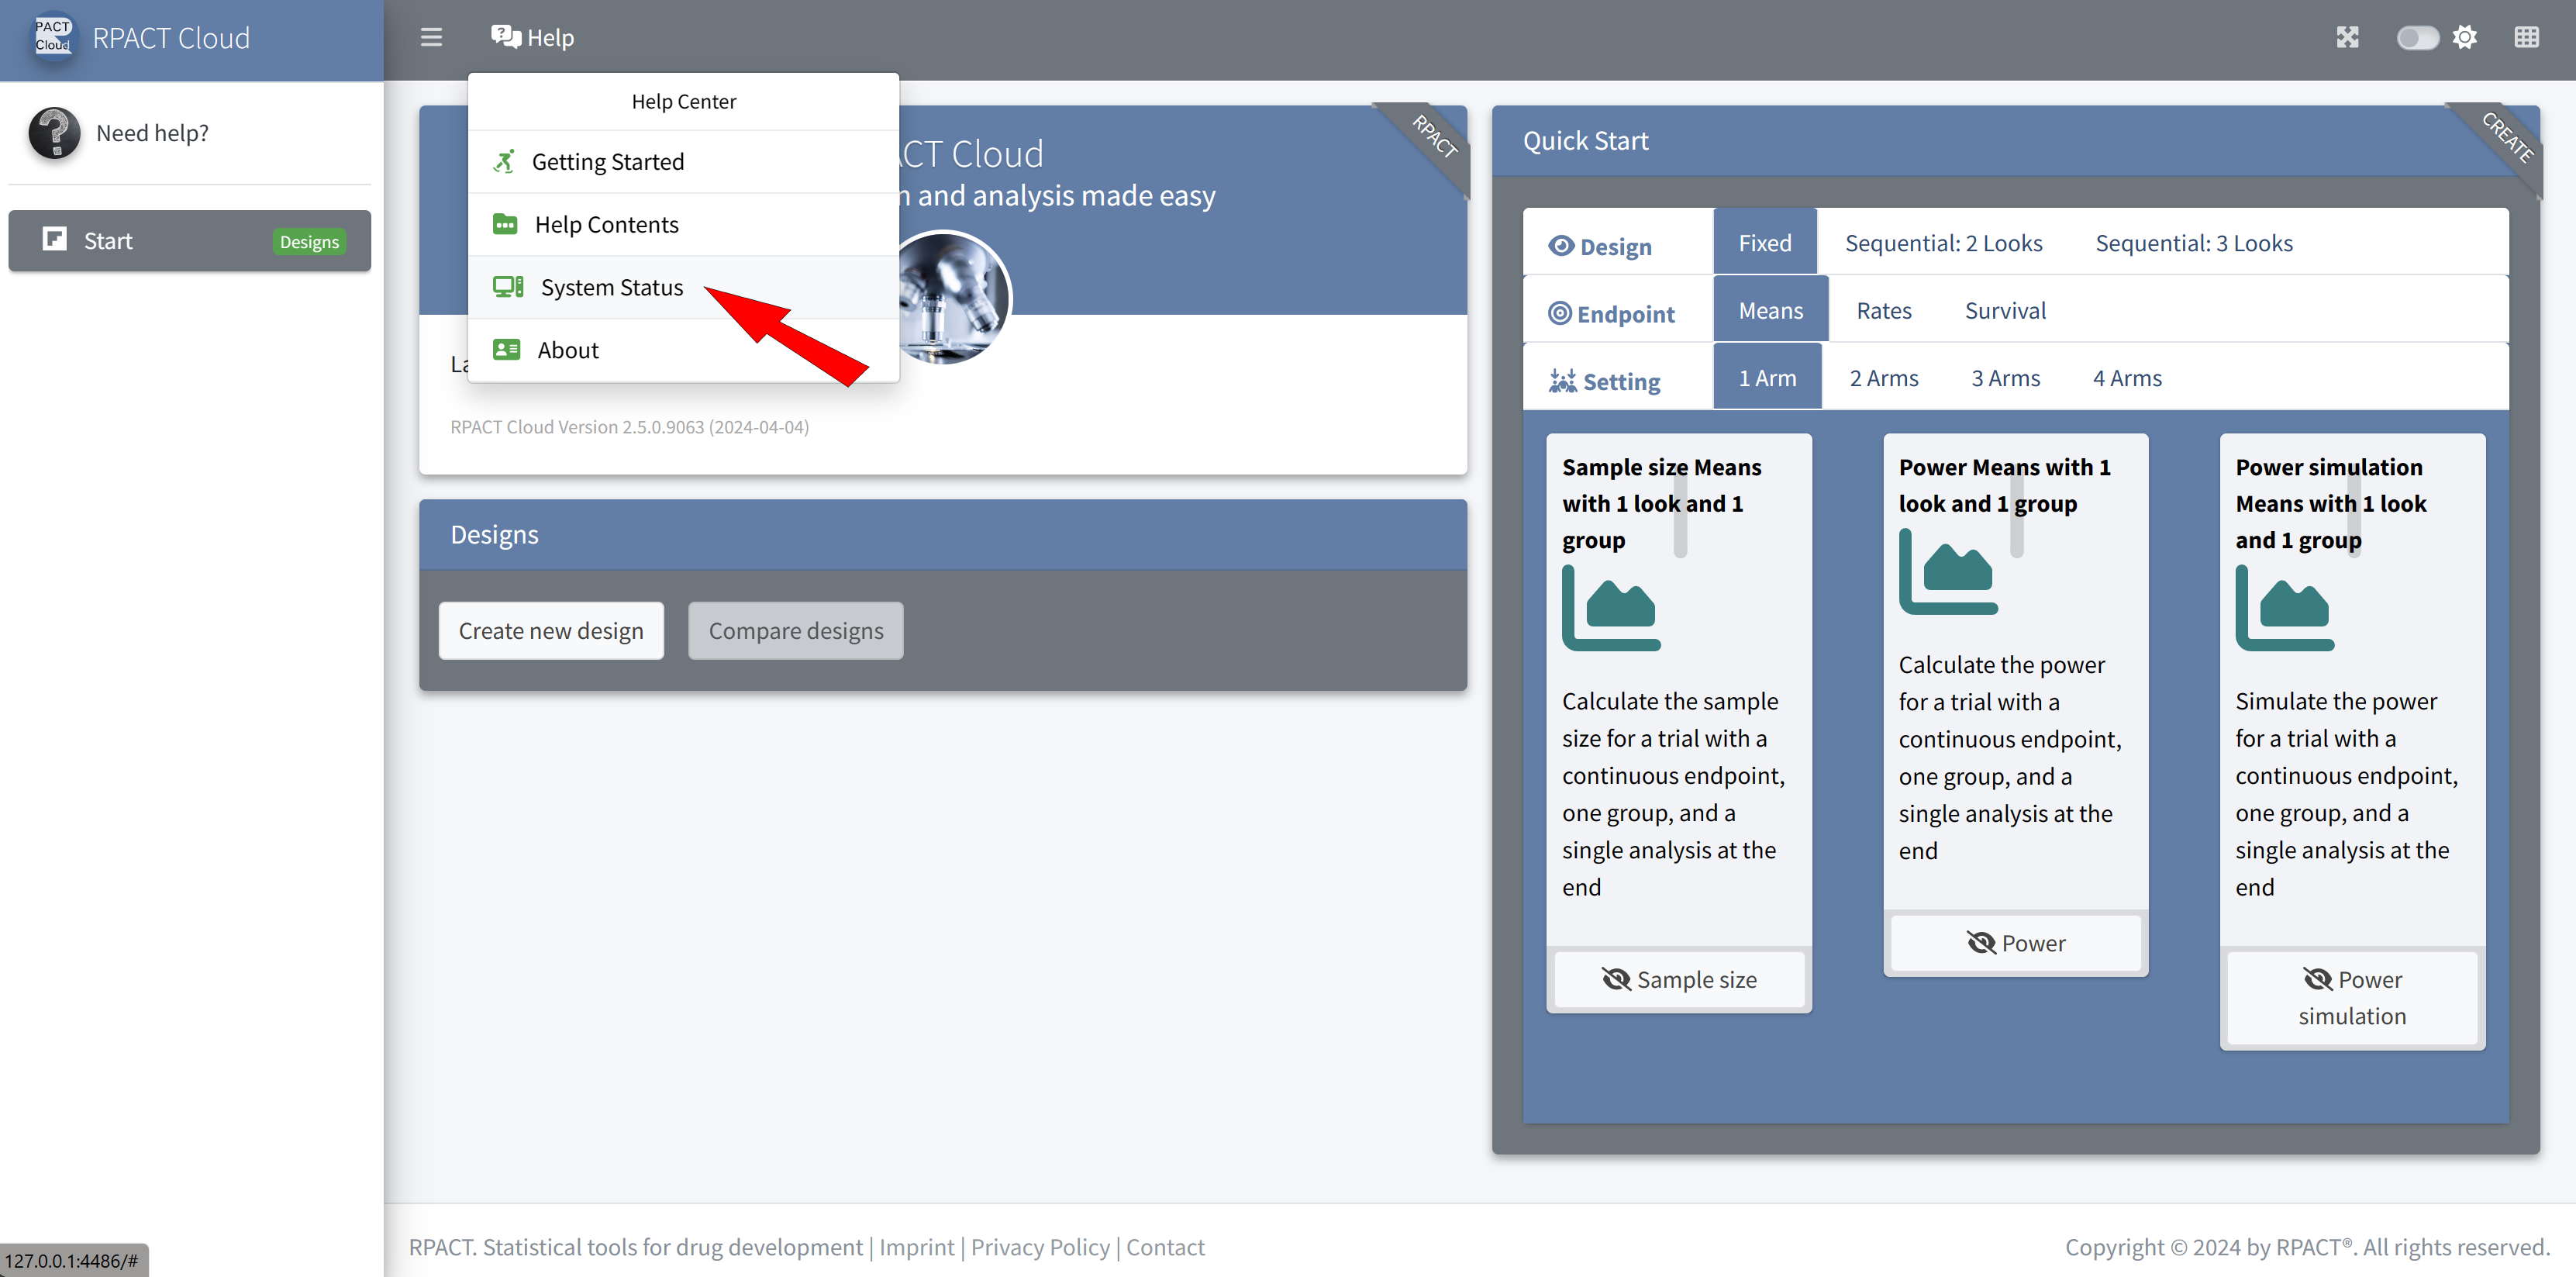
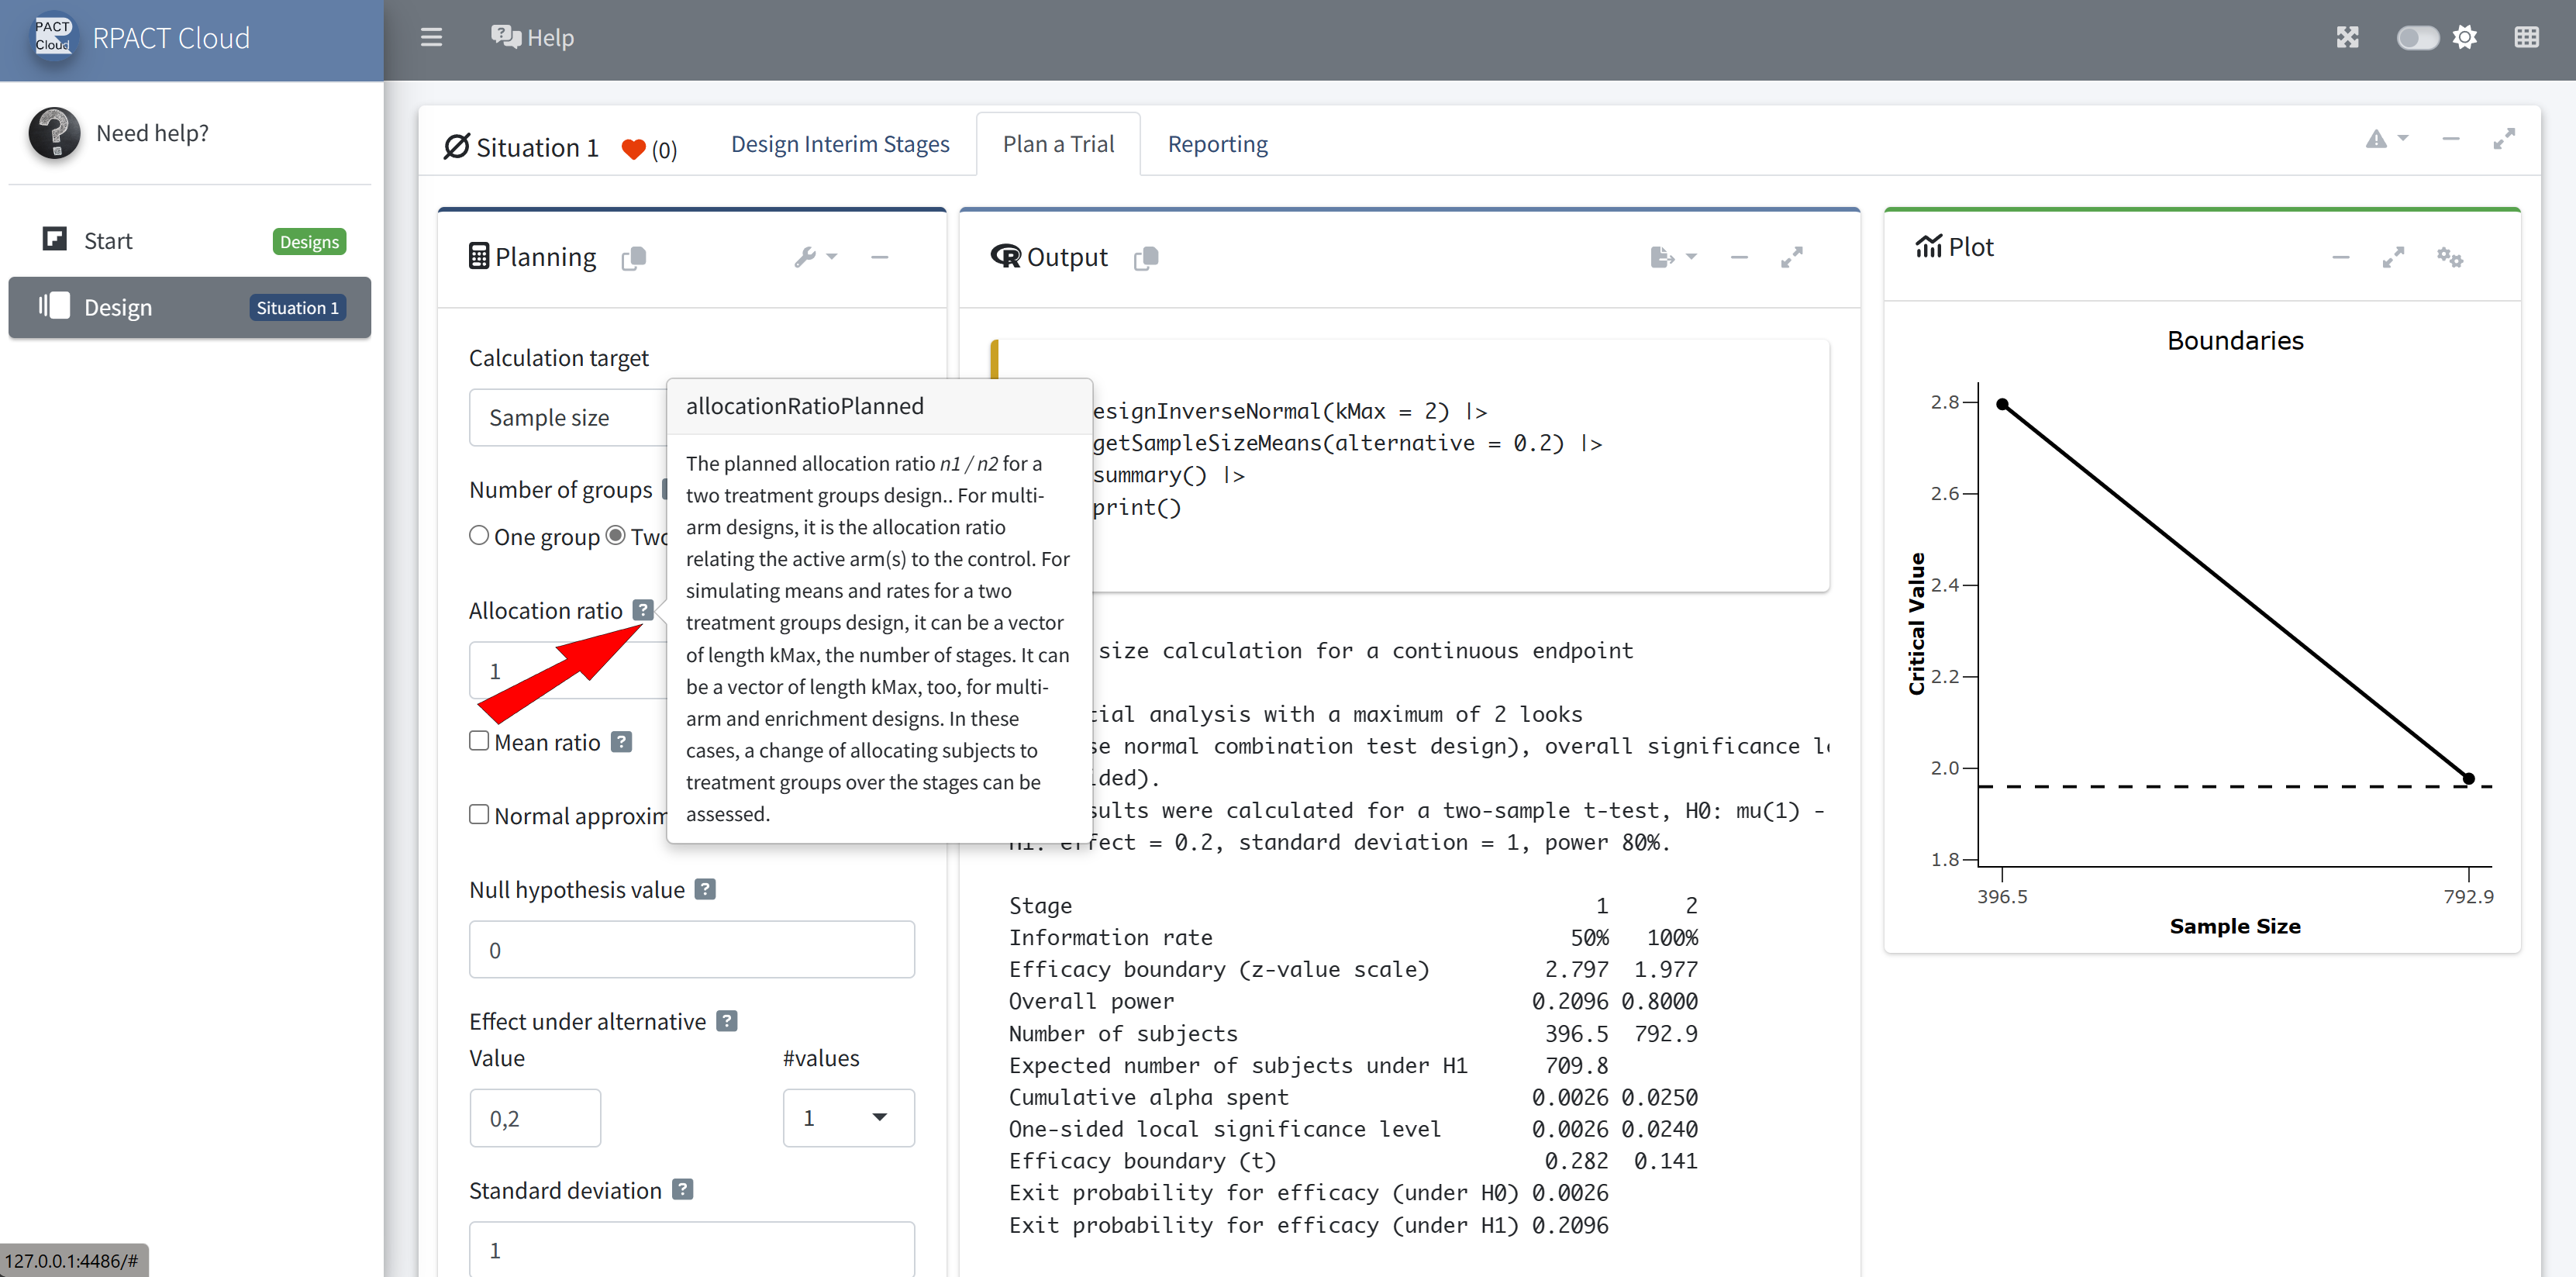
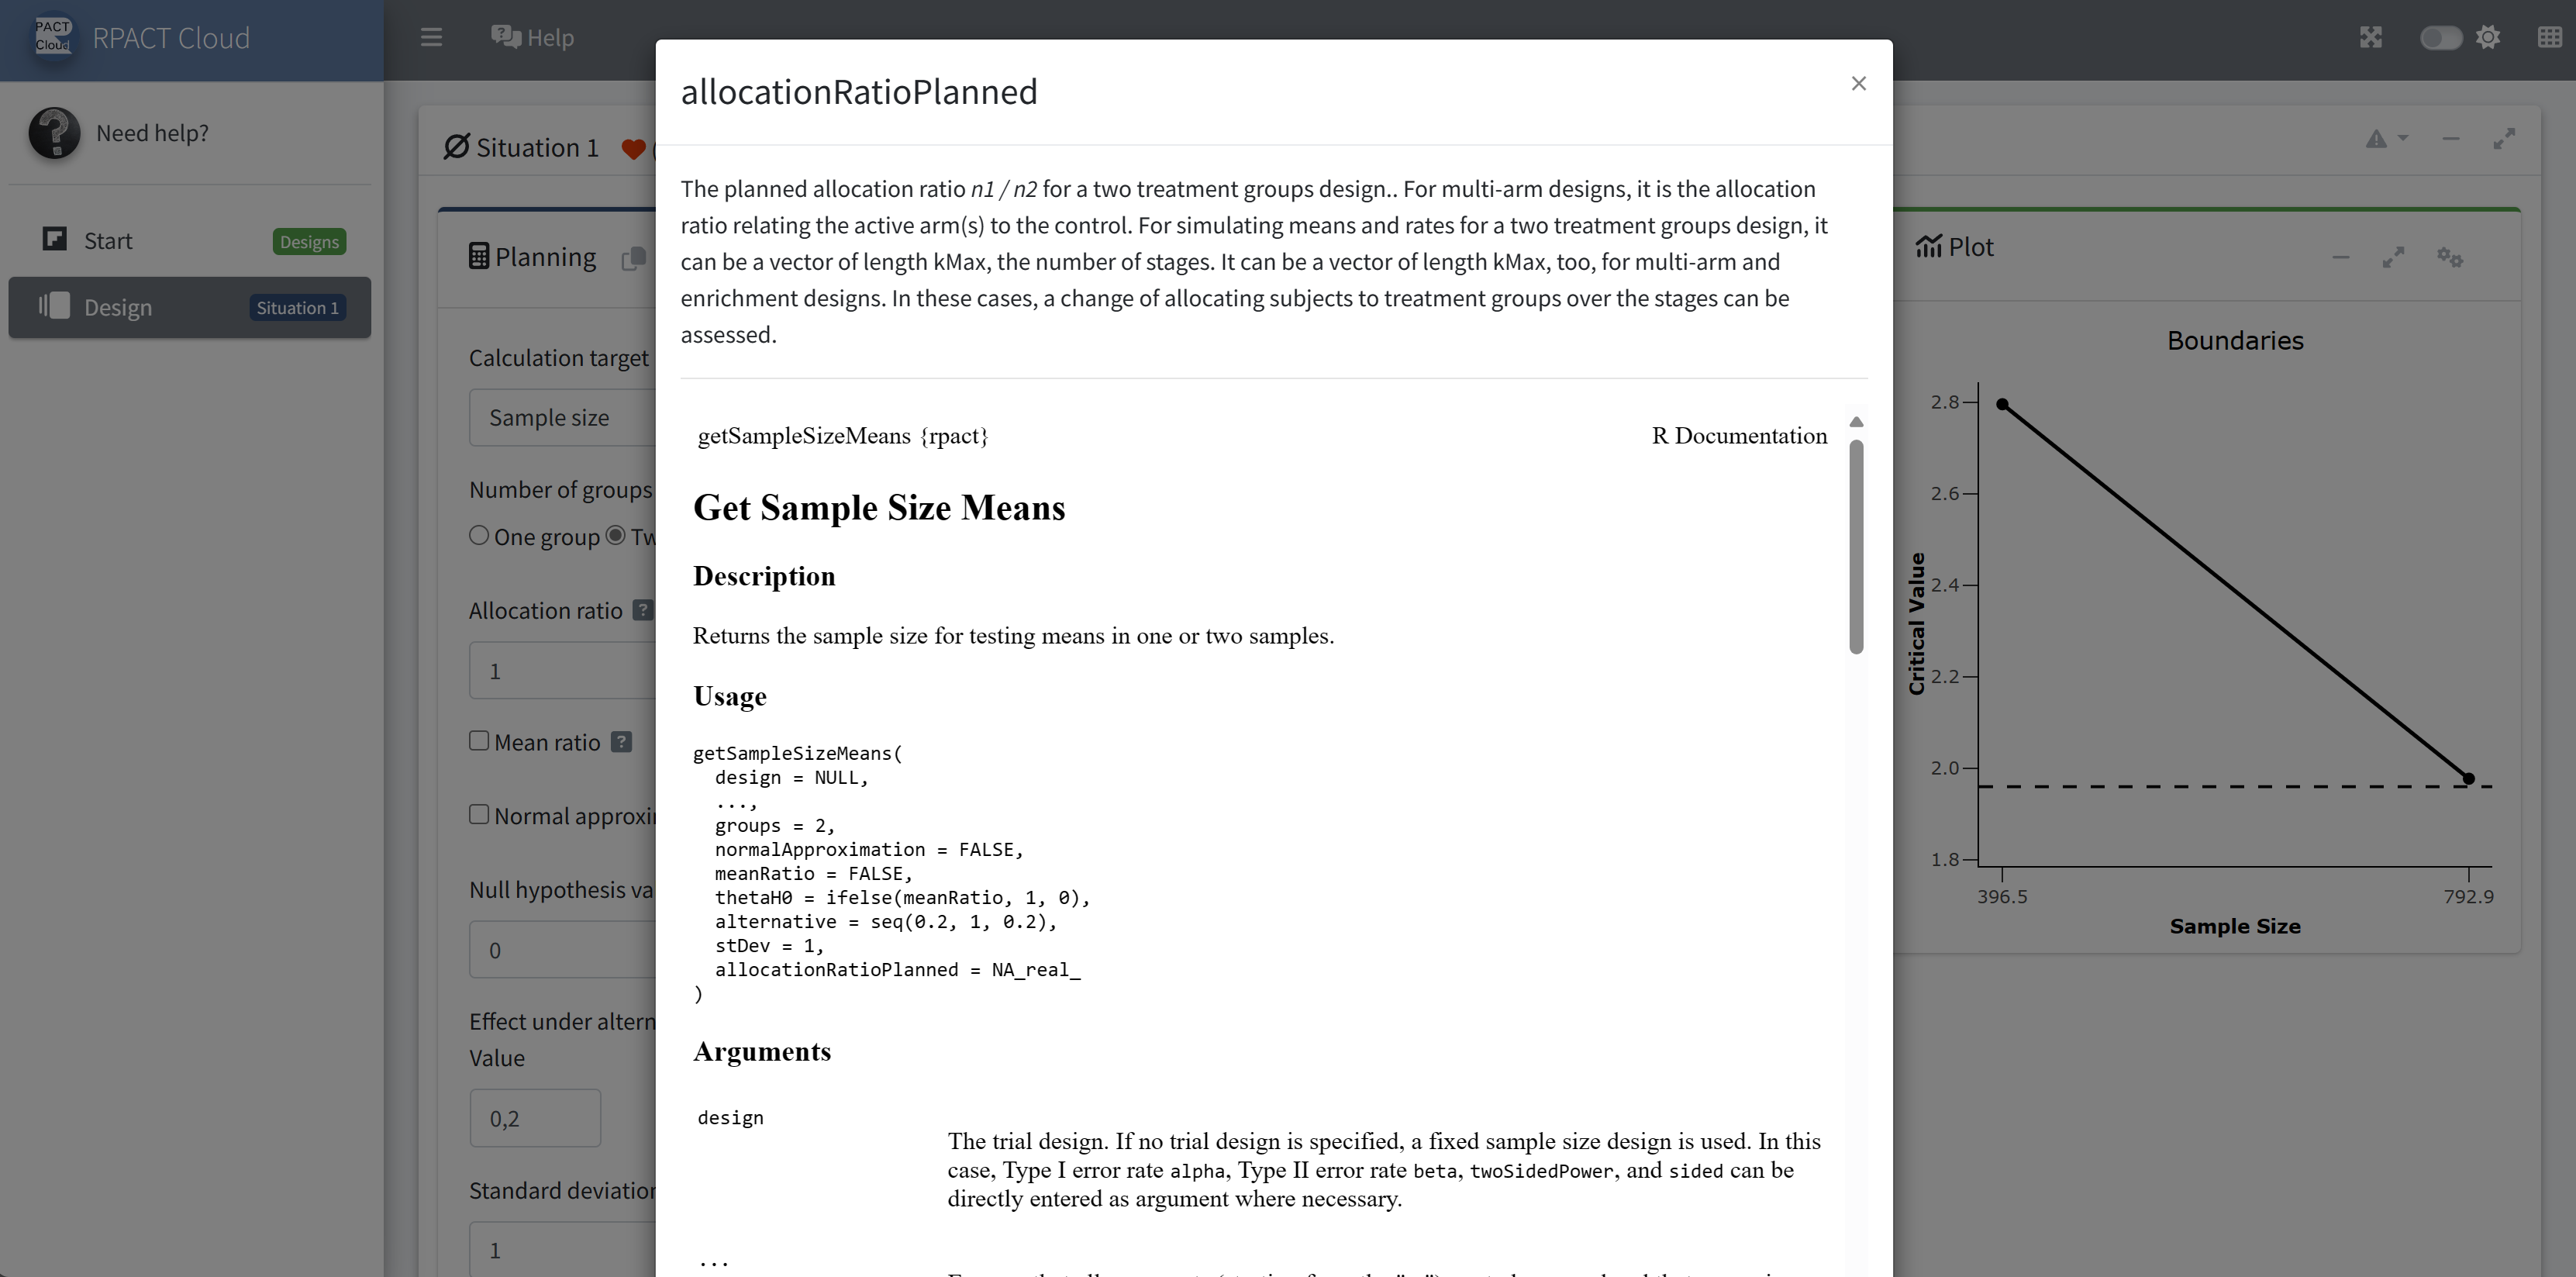
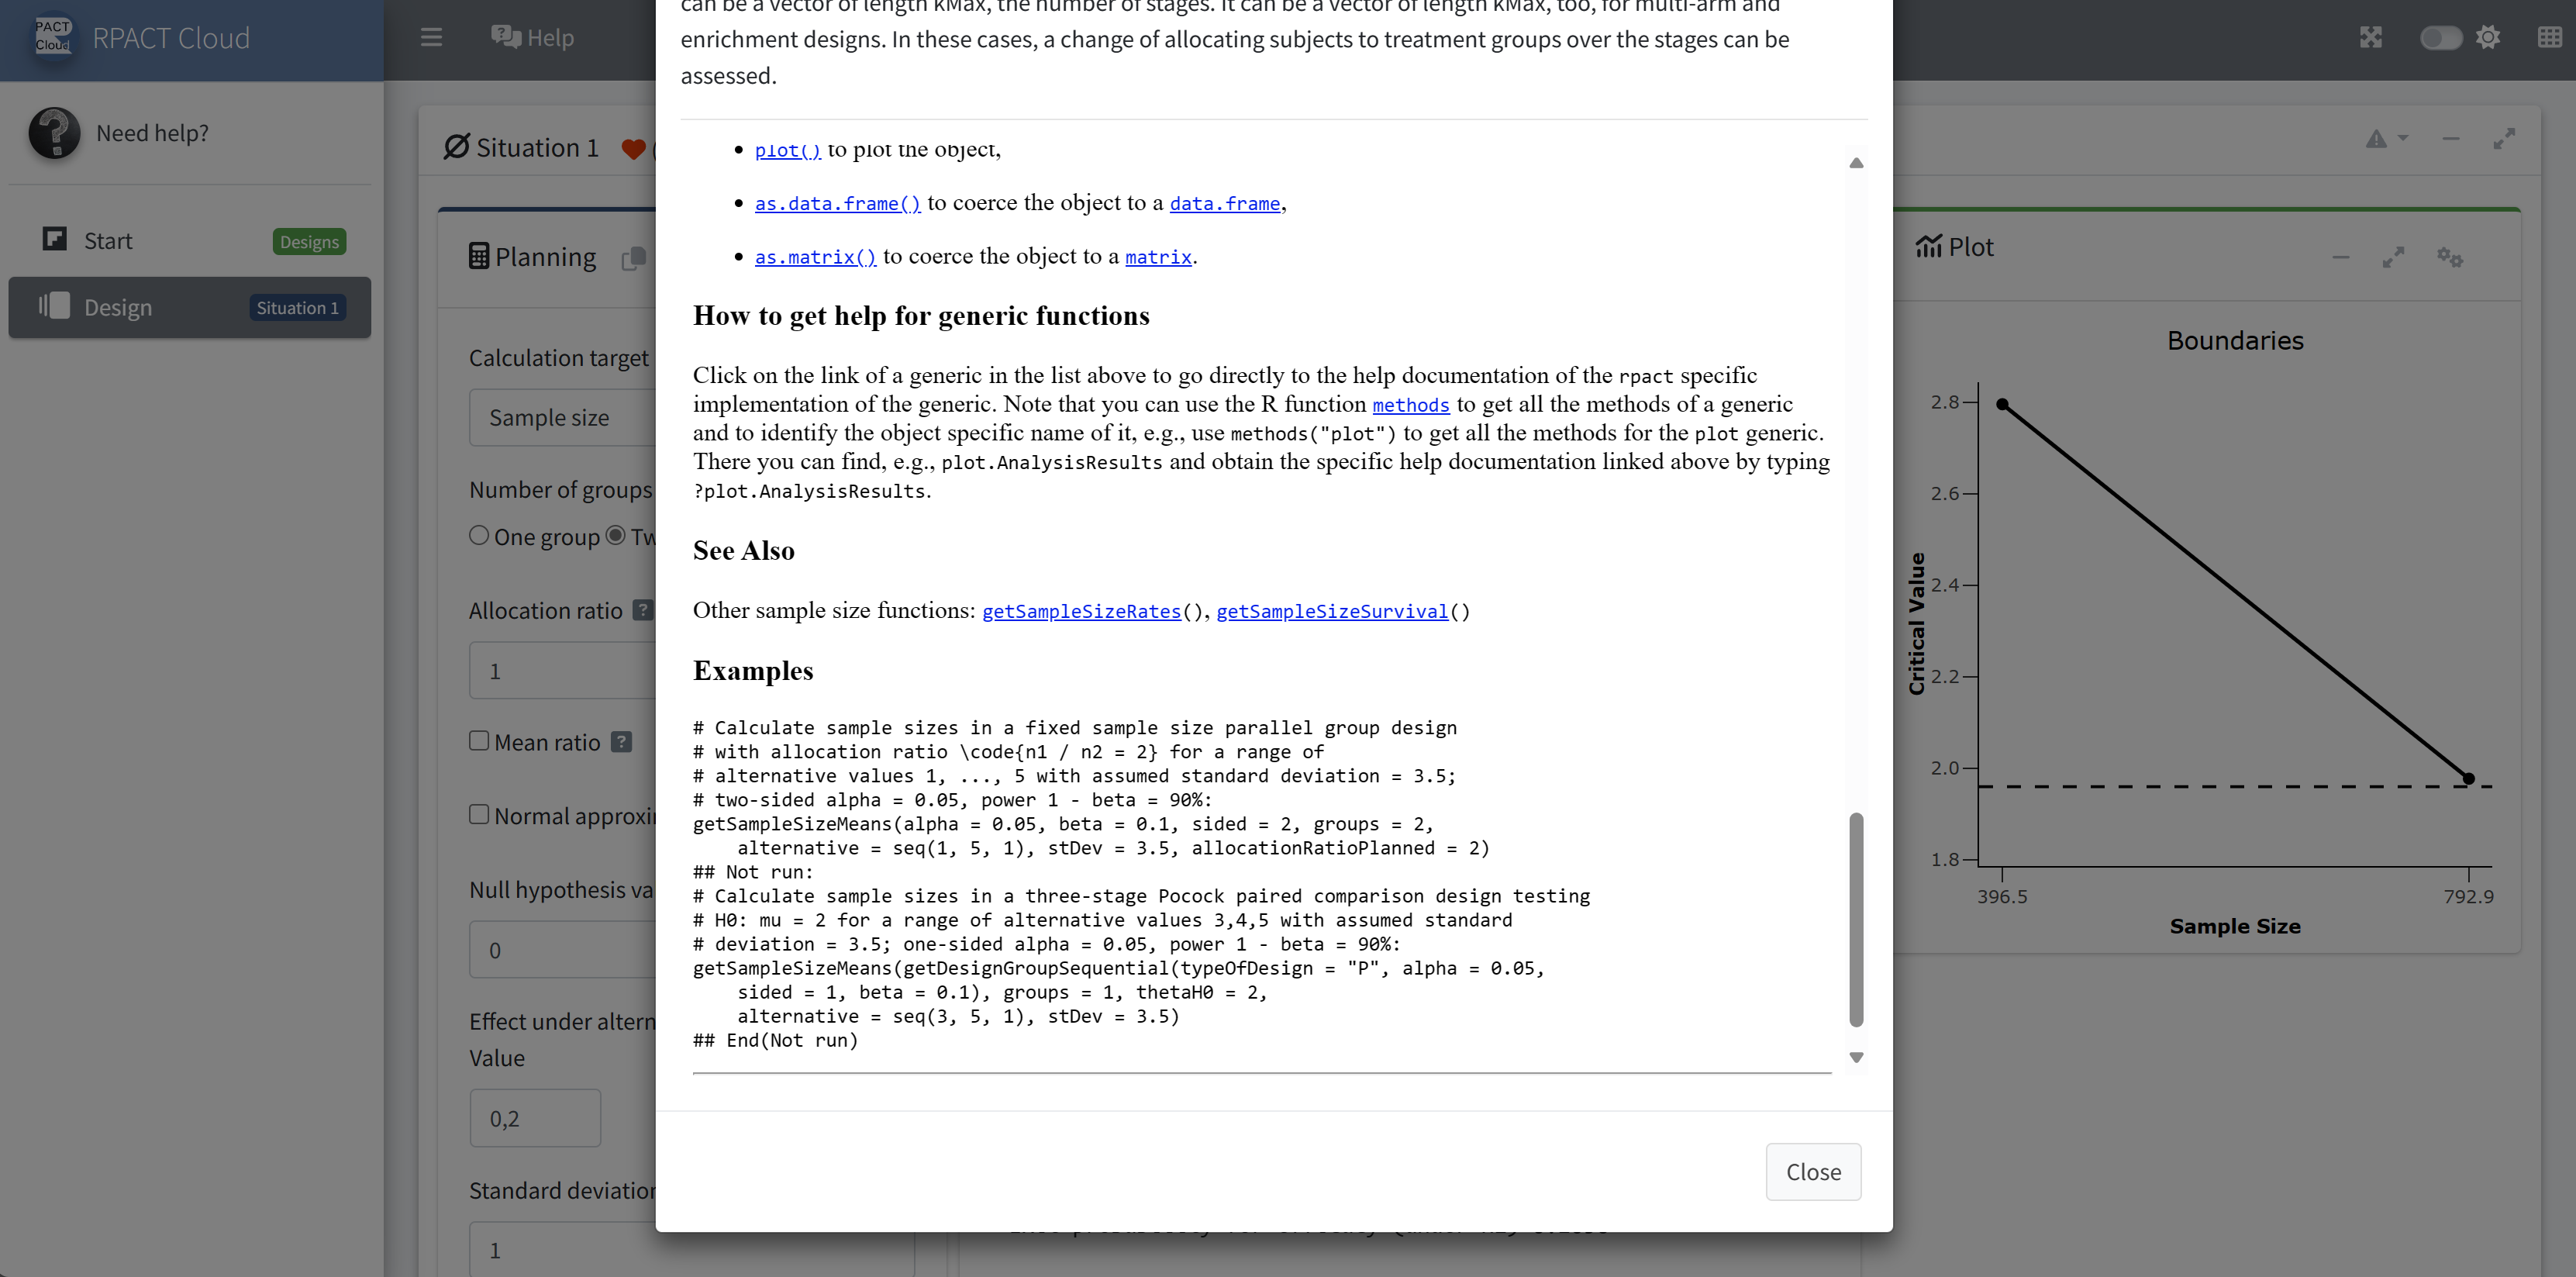
RPACT Cloud – Getting Help
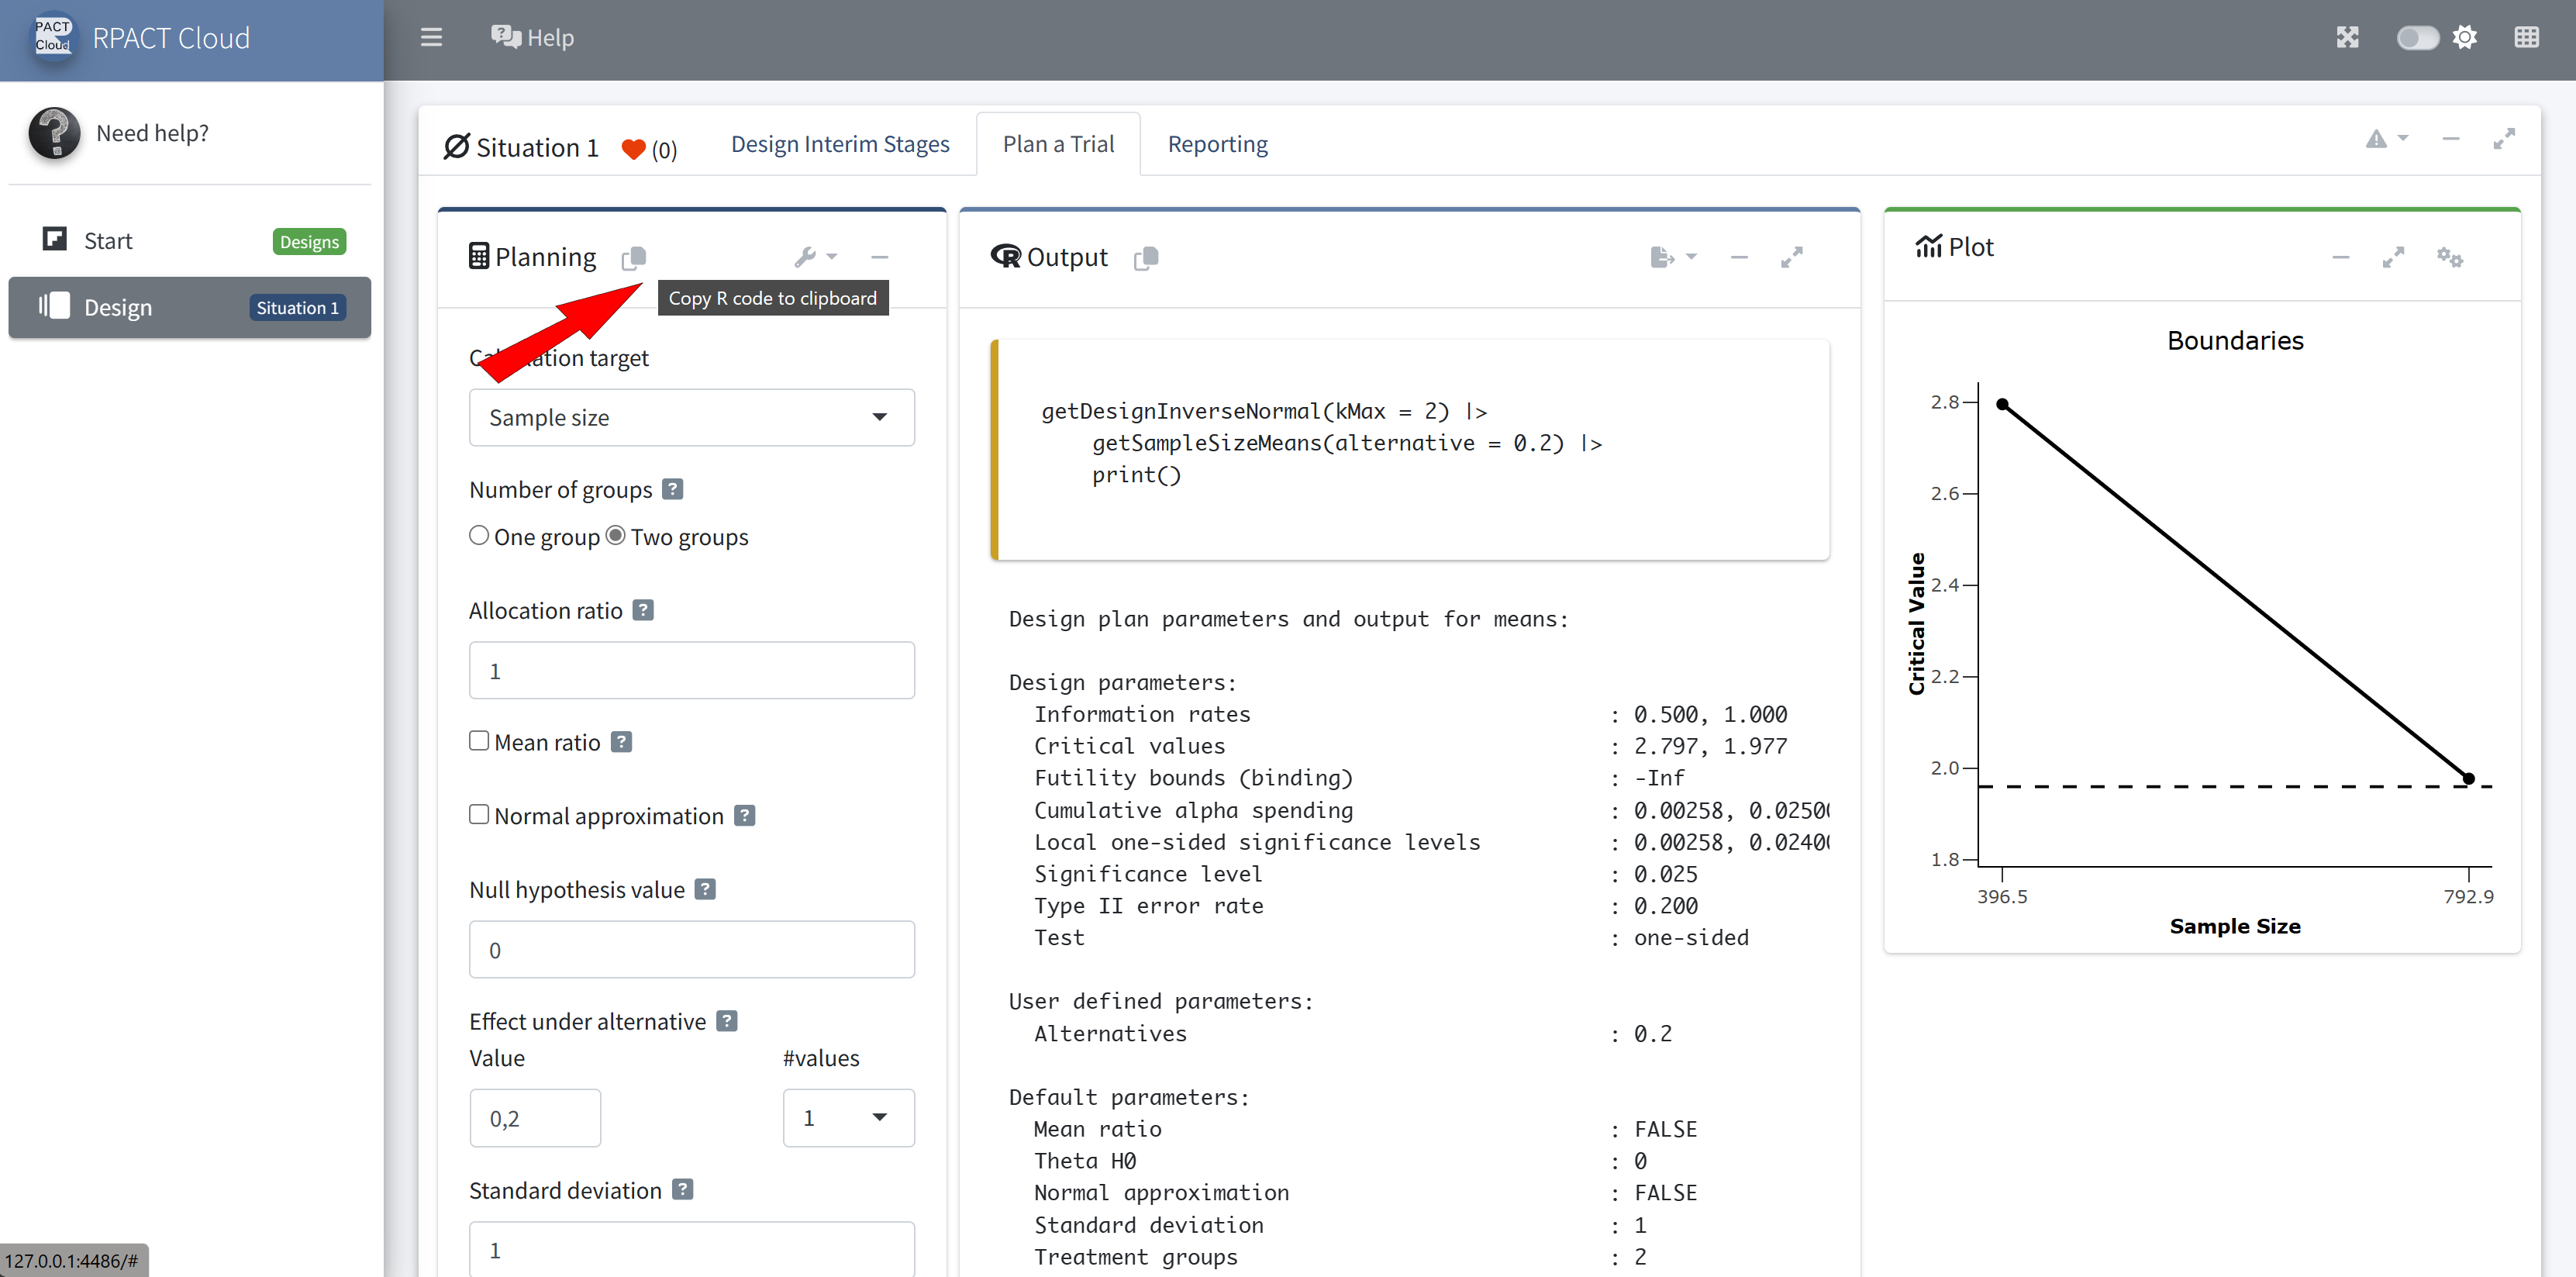
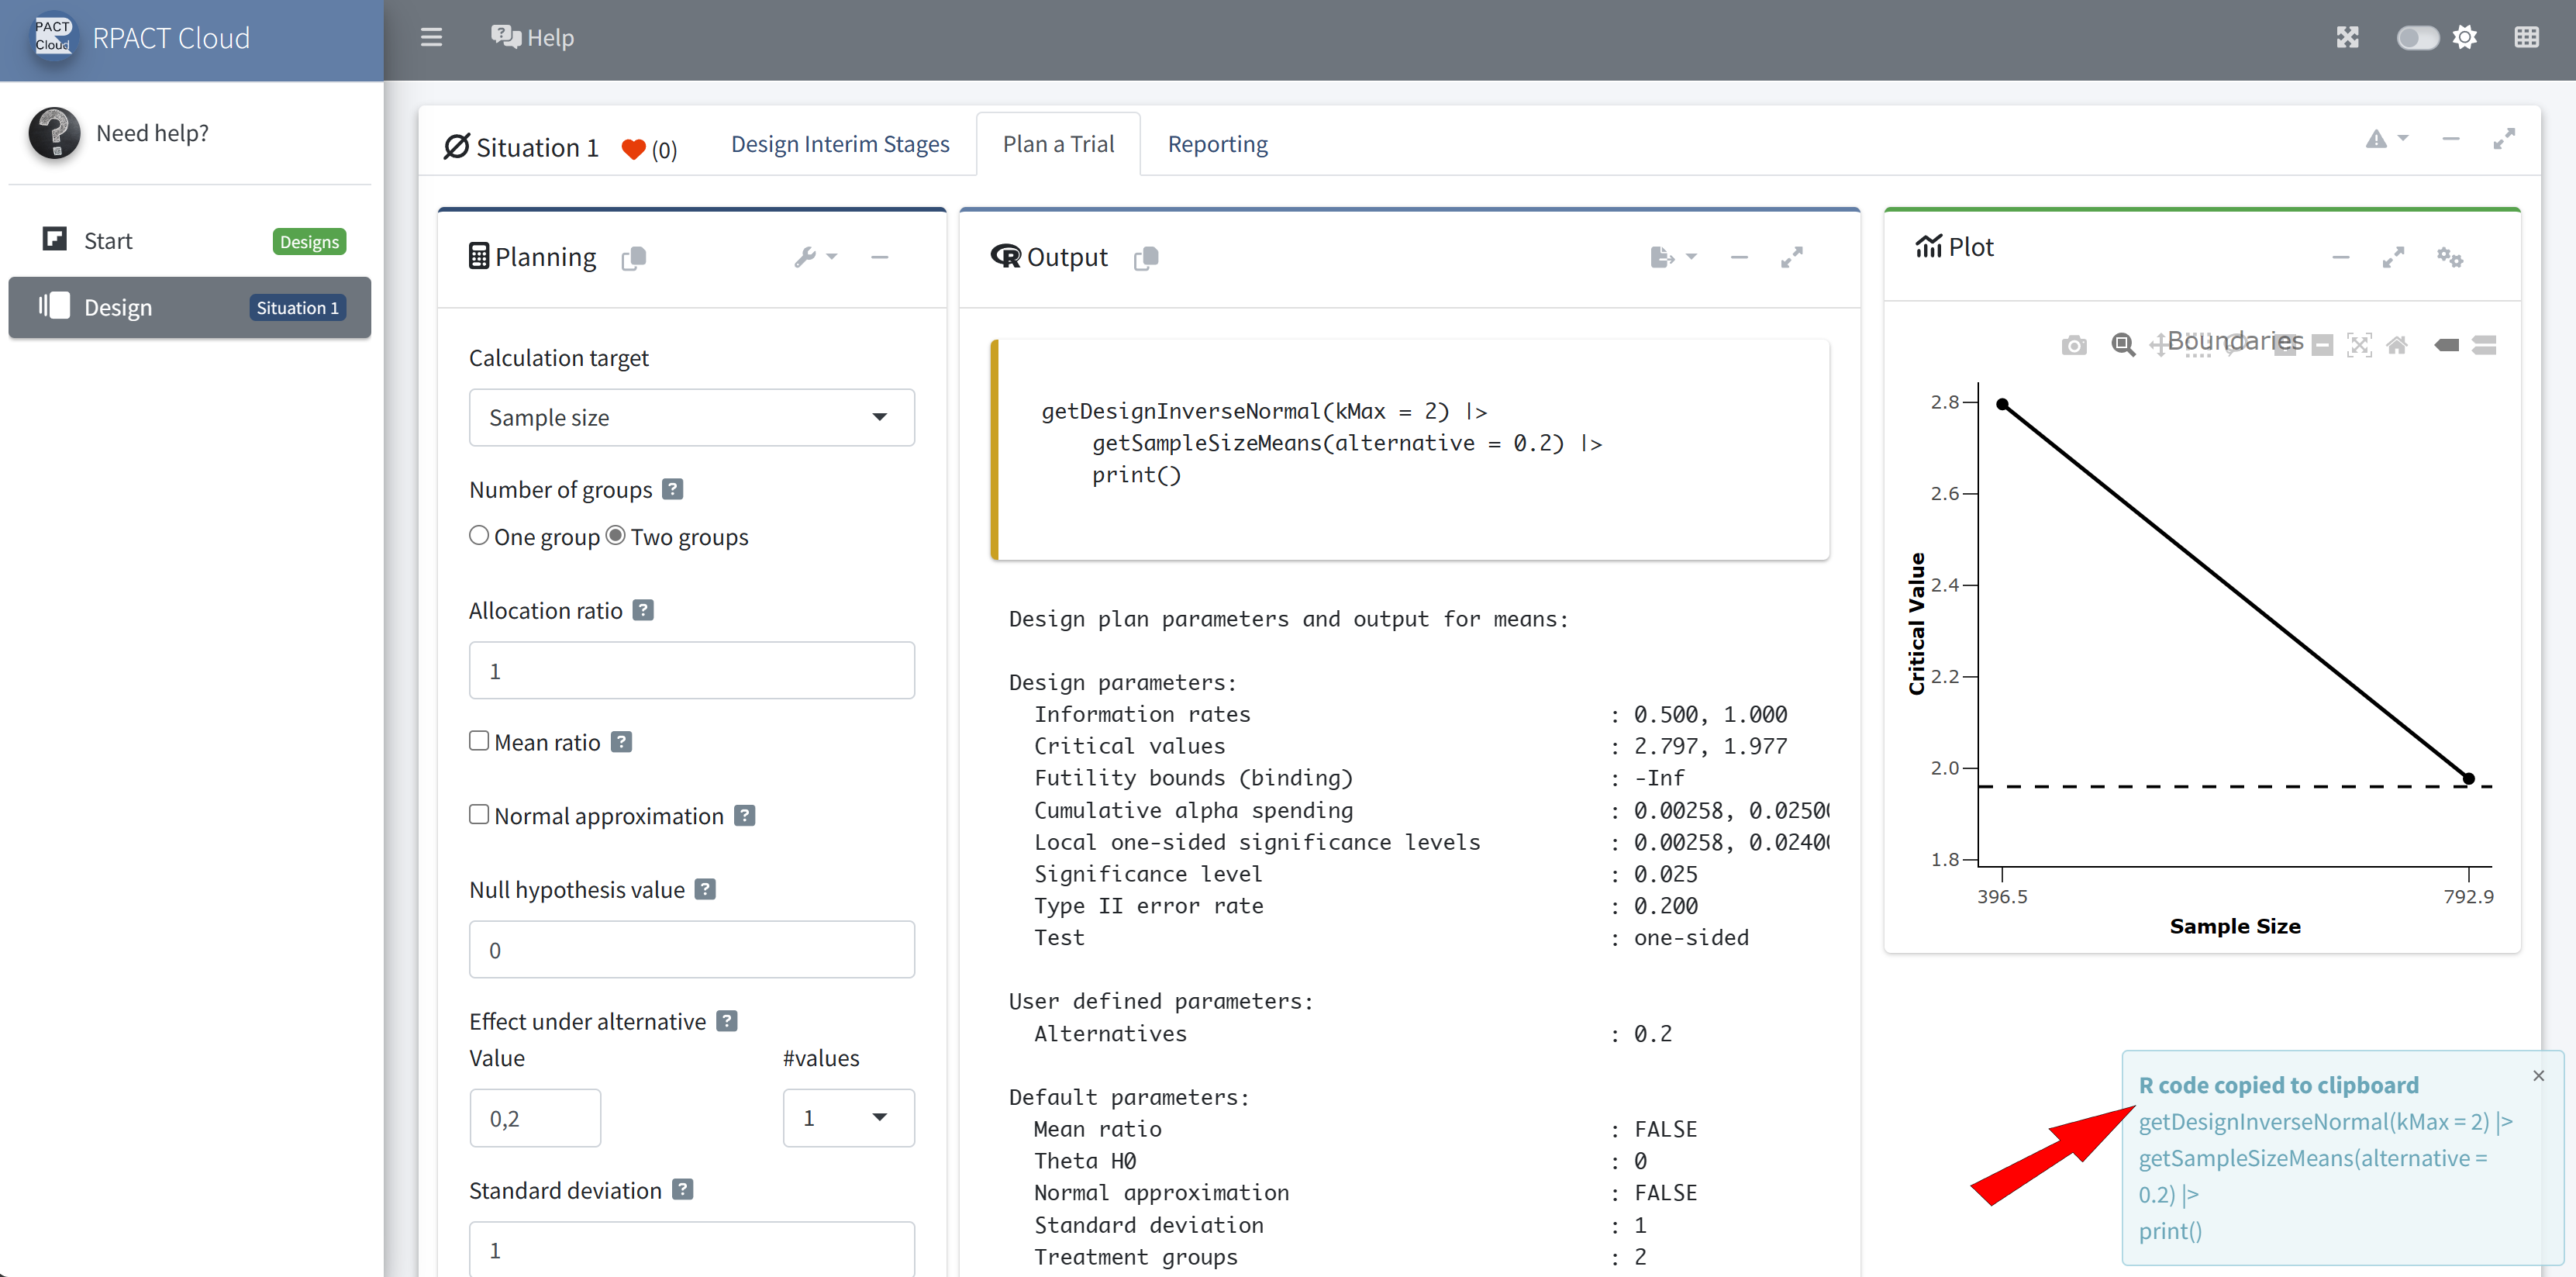
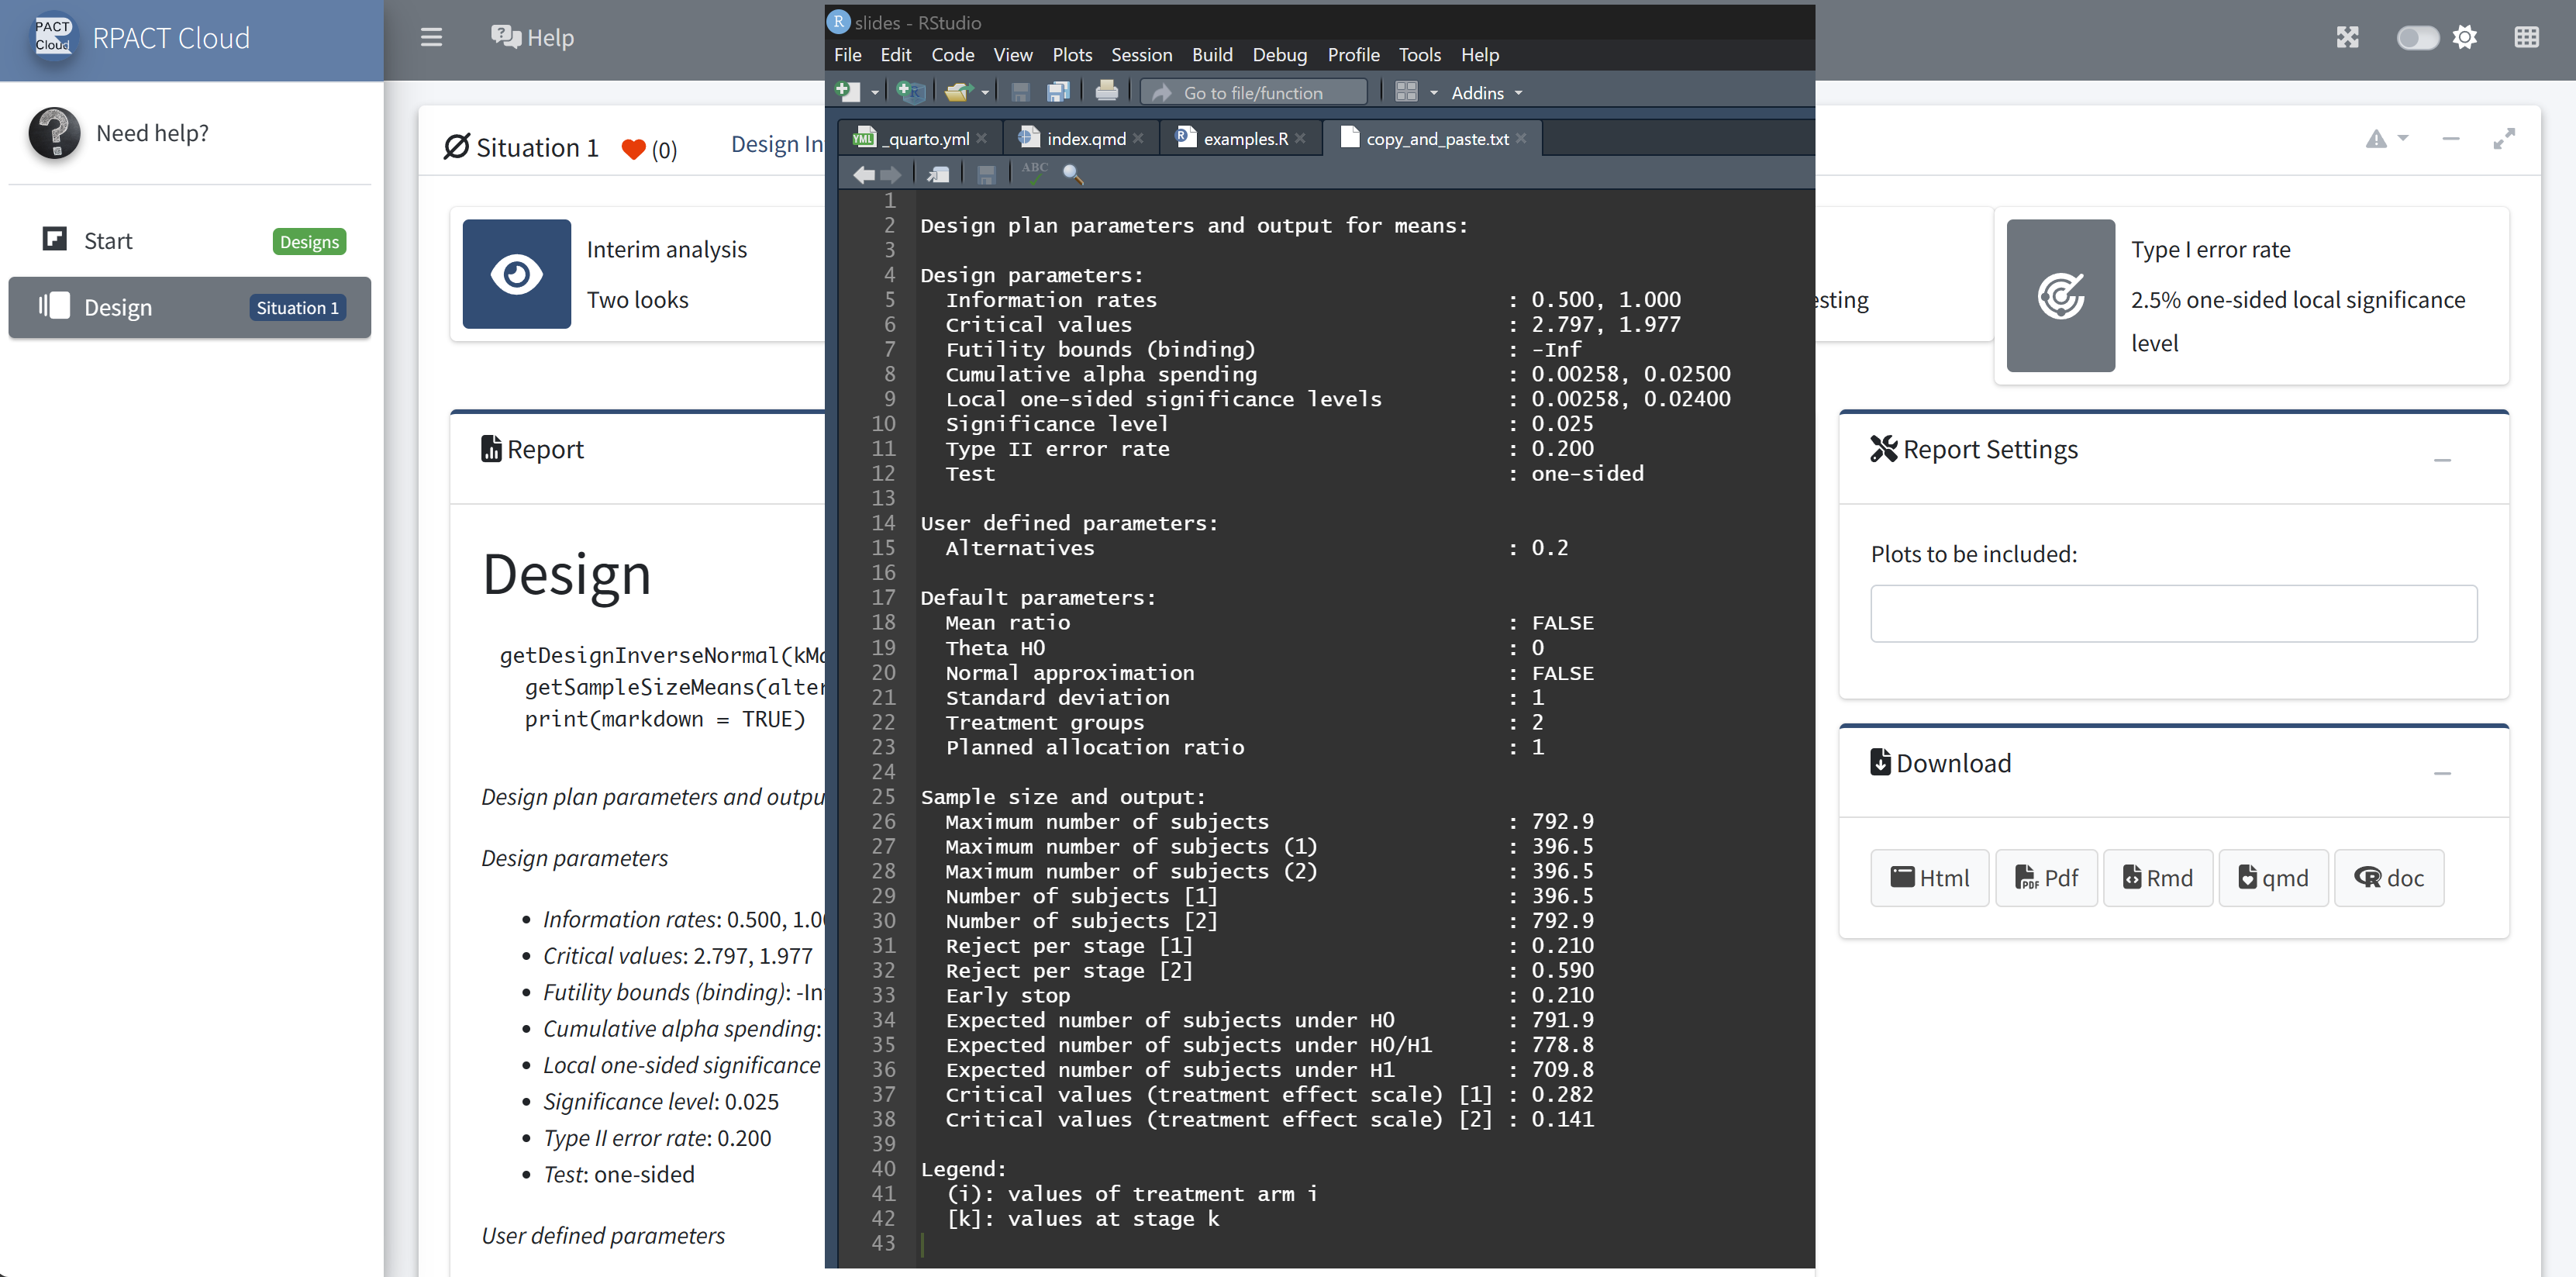
RPACT Cloud – Copy And Paste
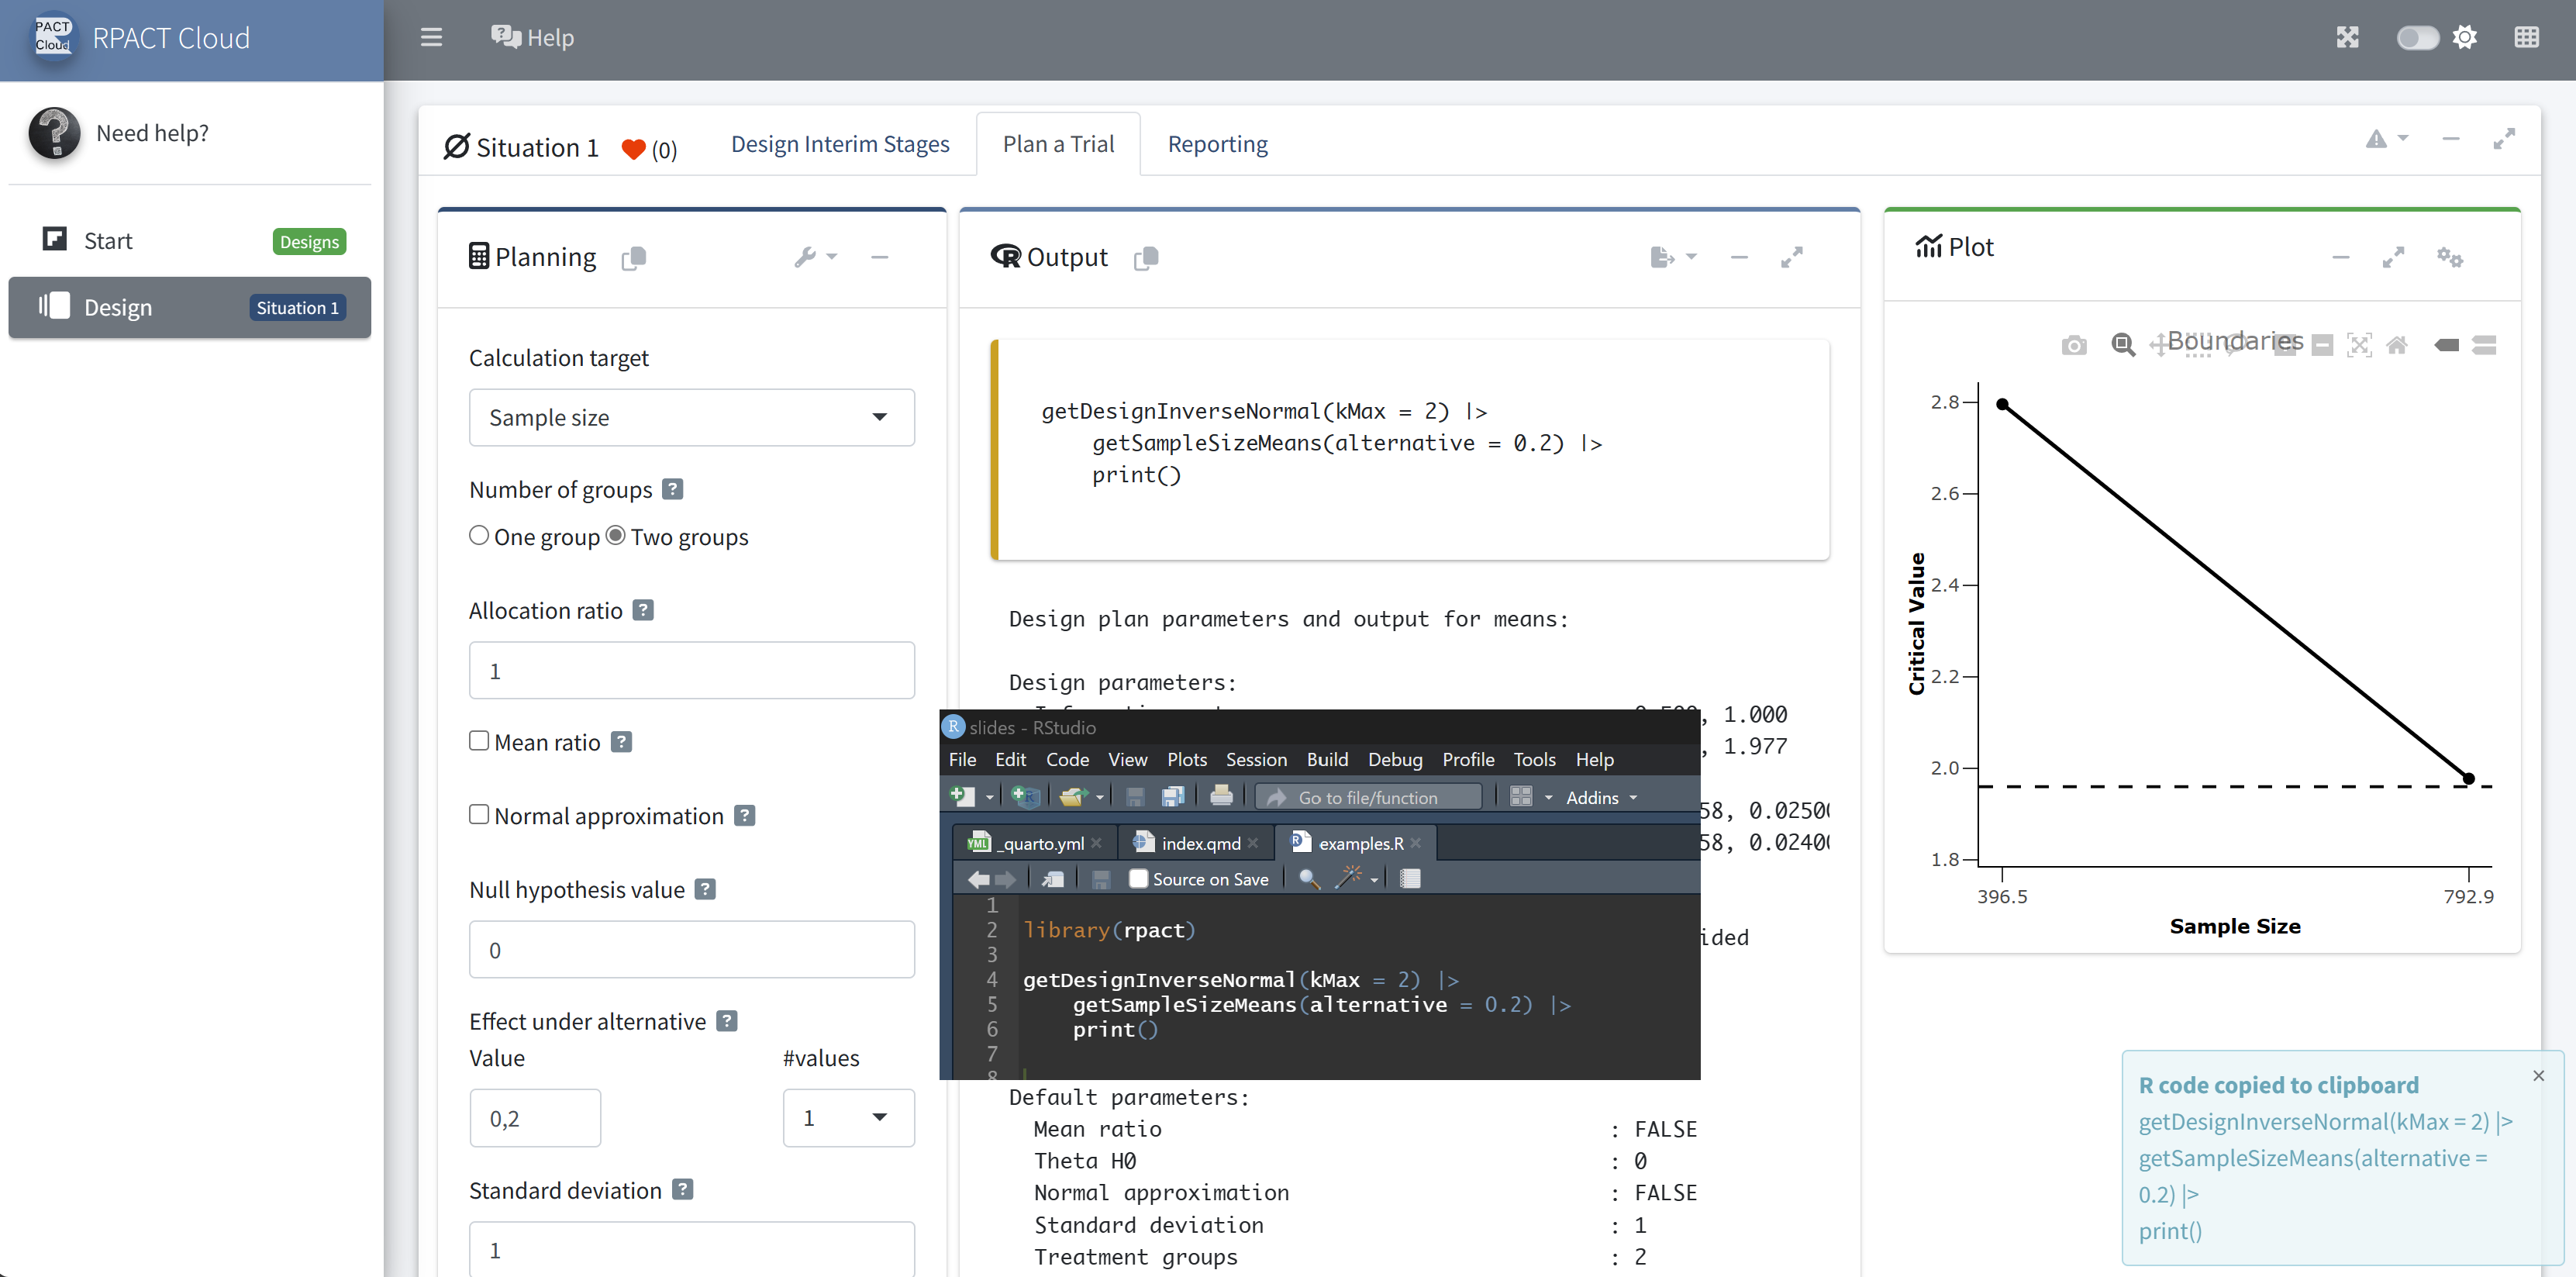
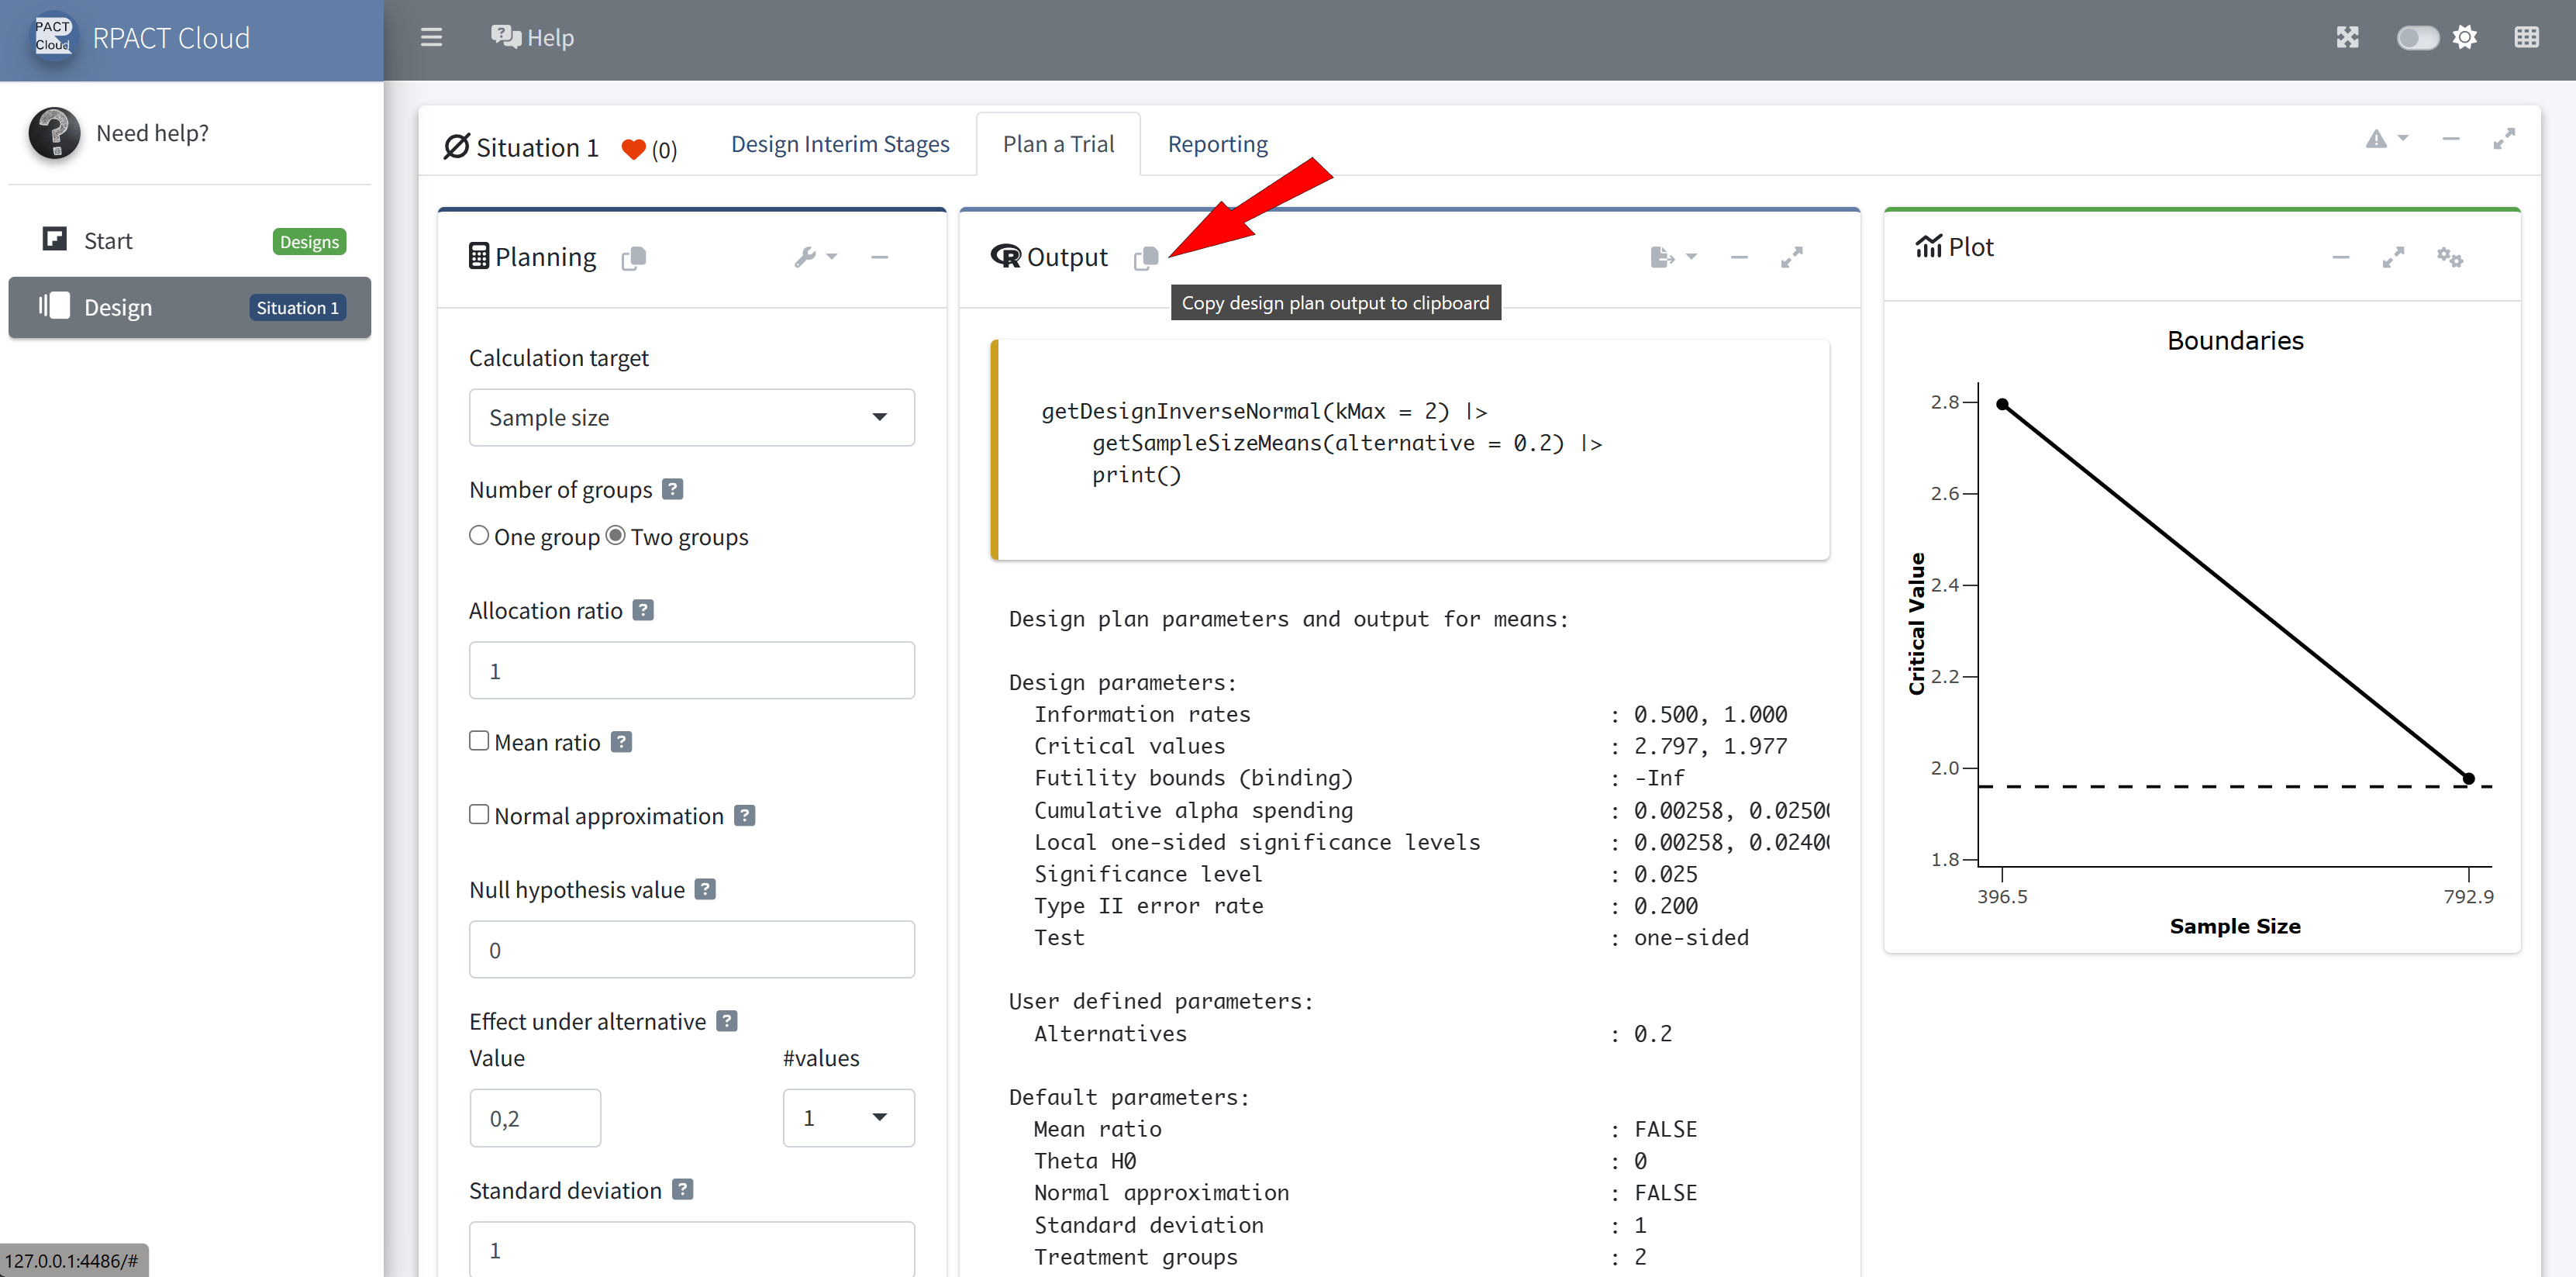
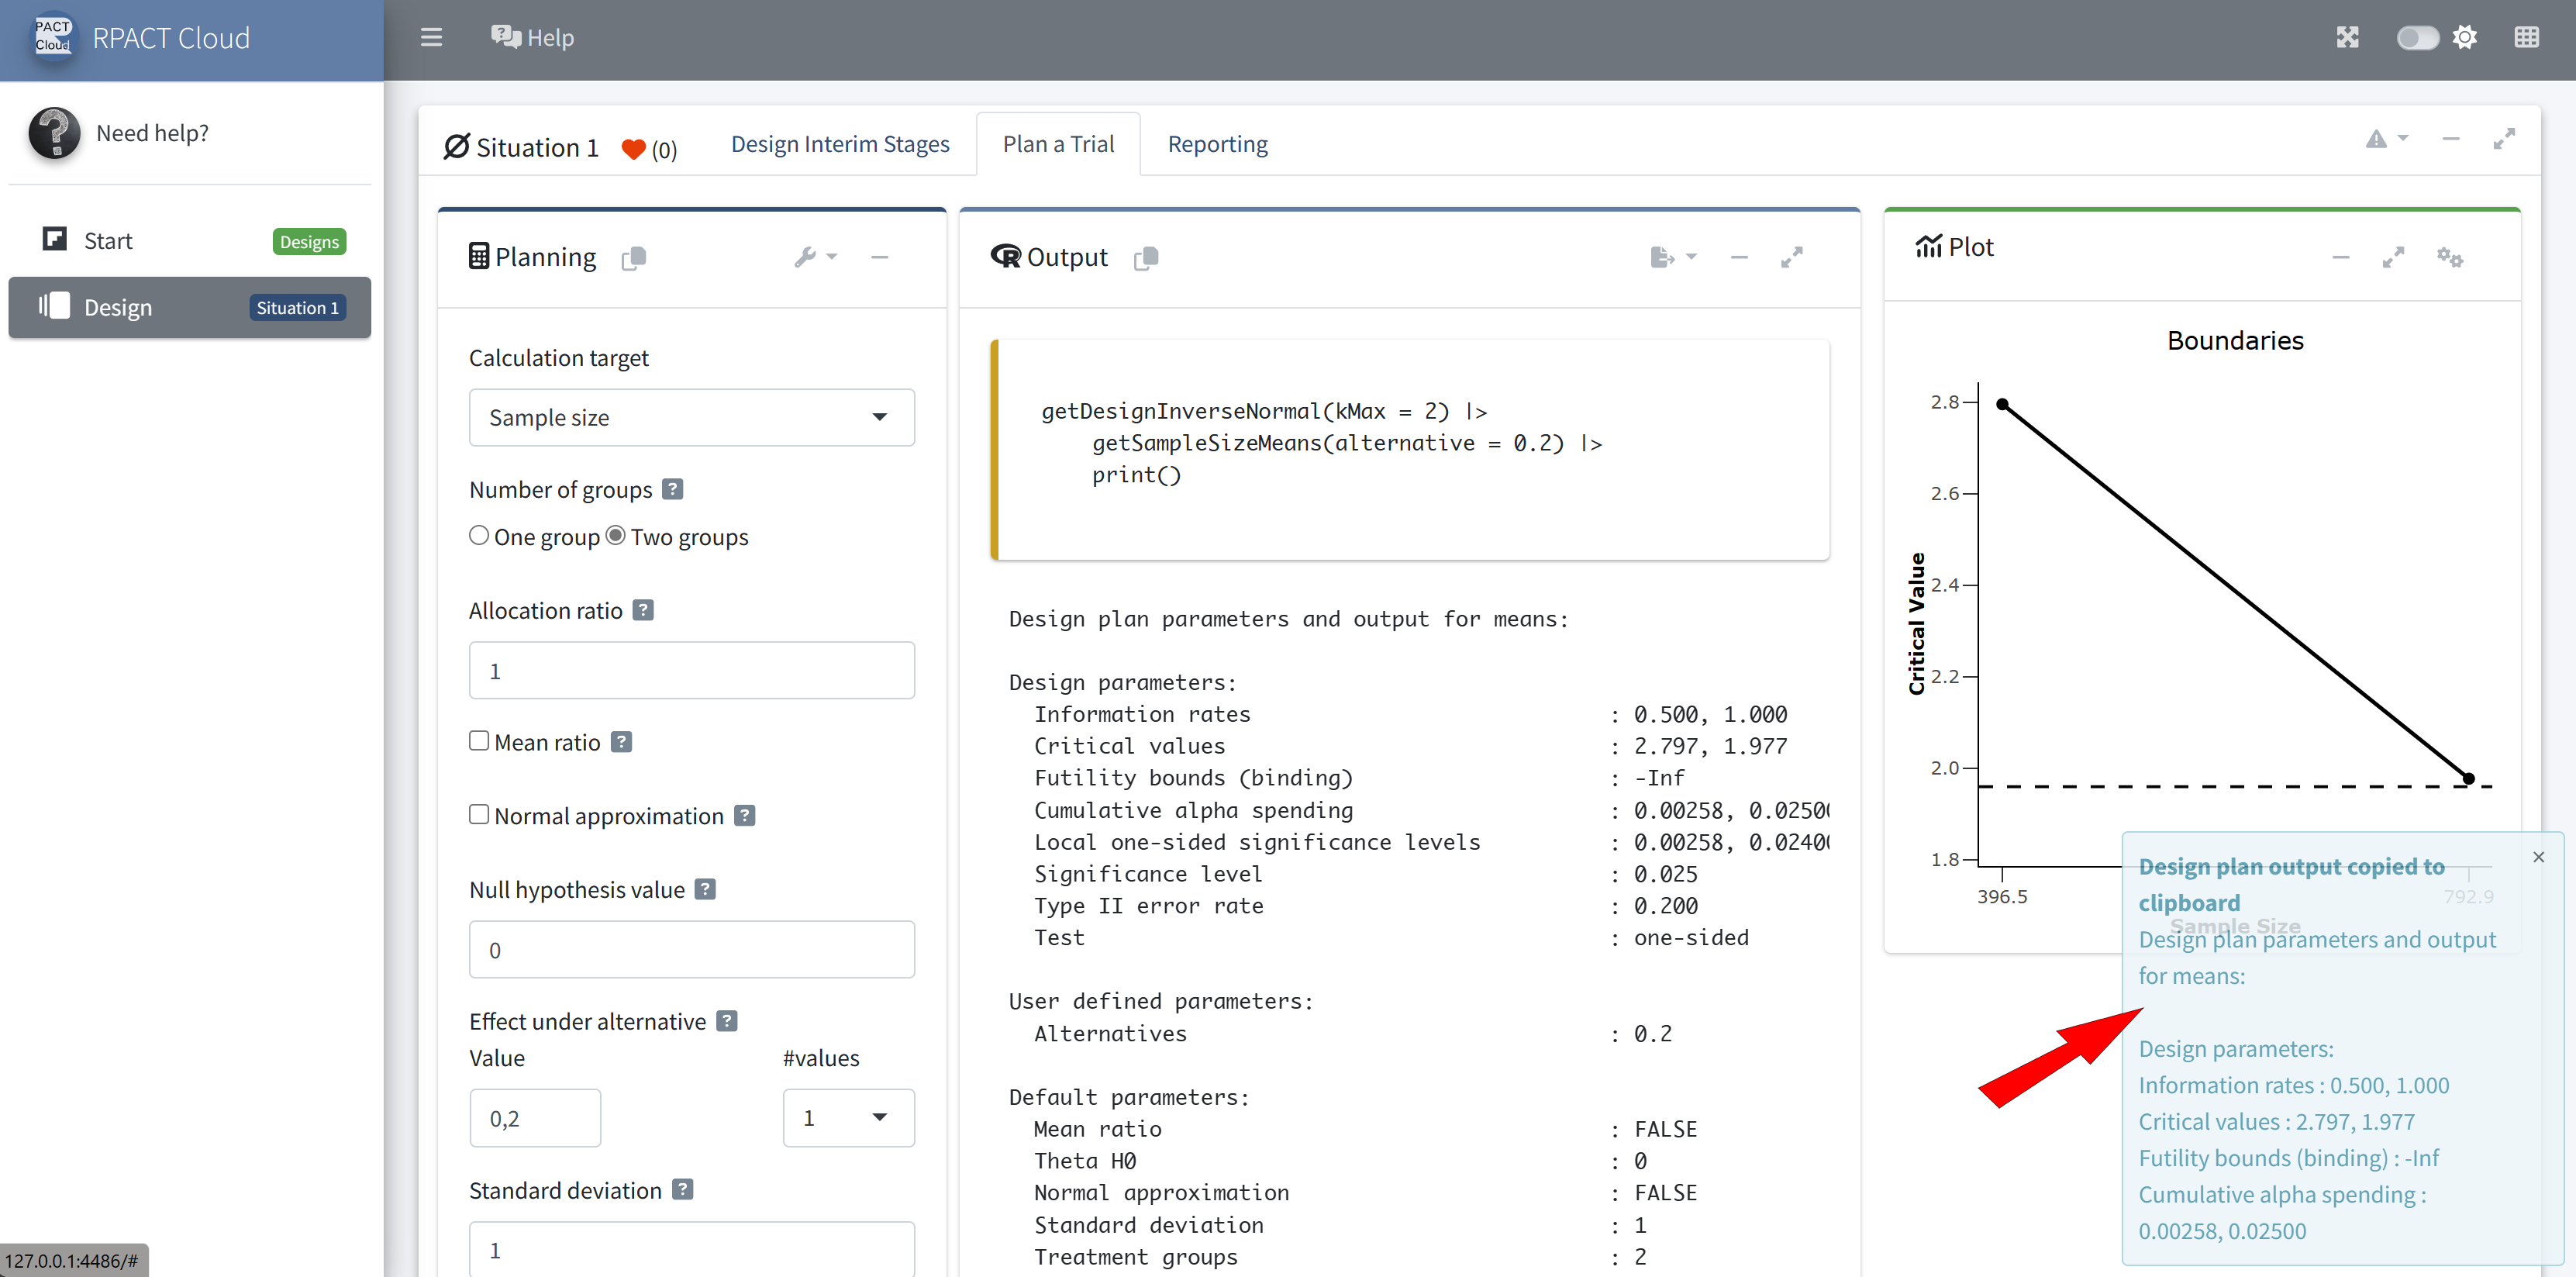
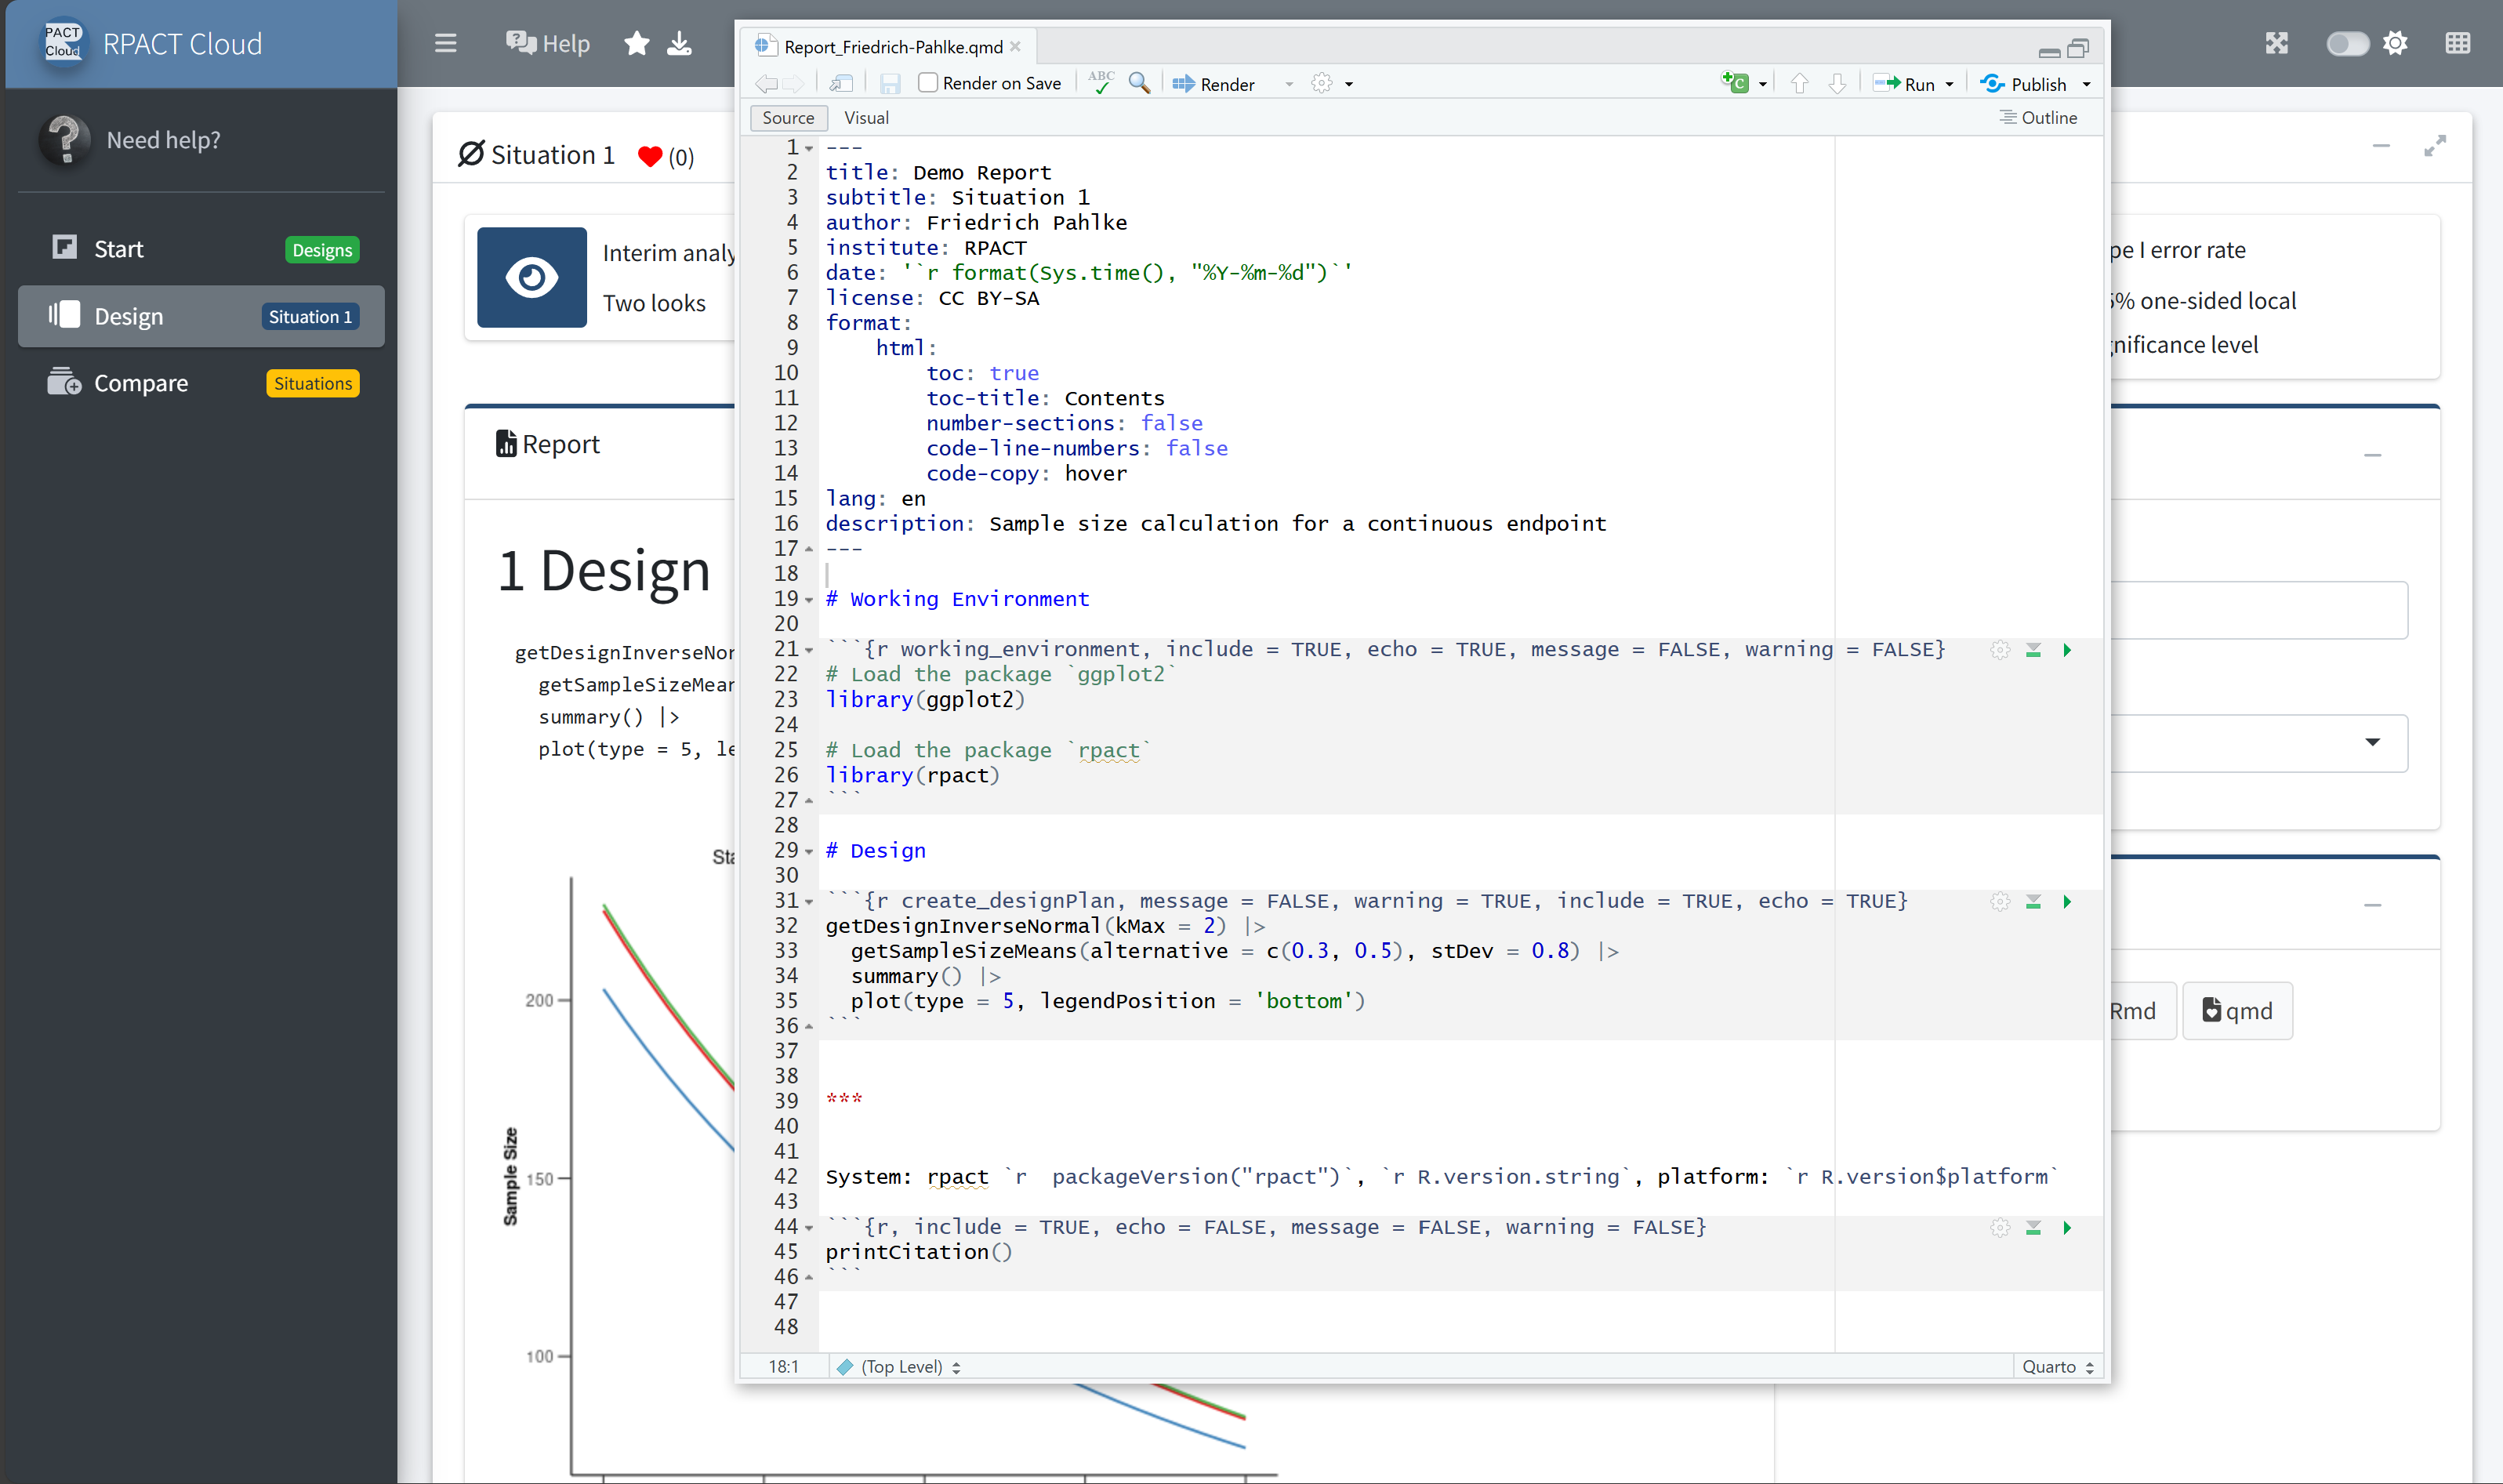
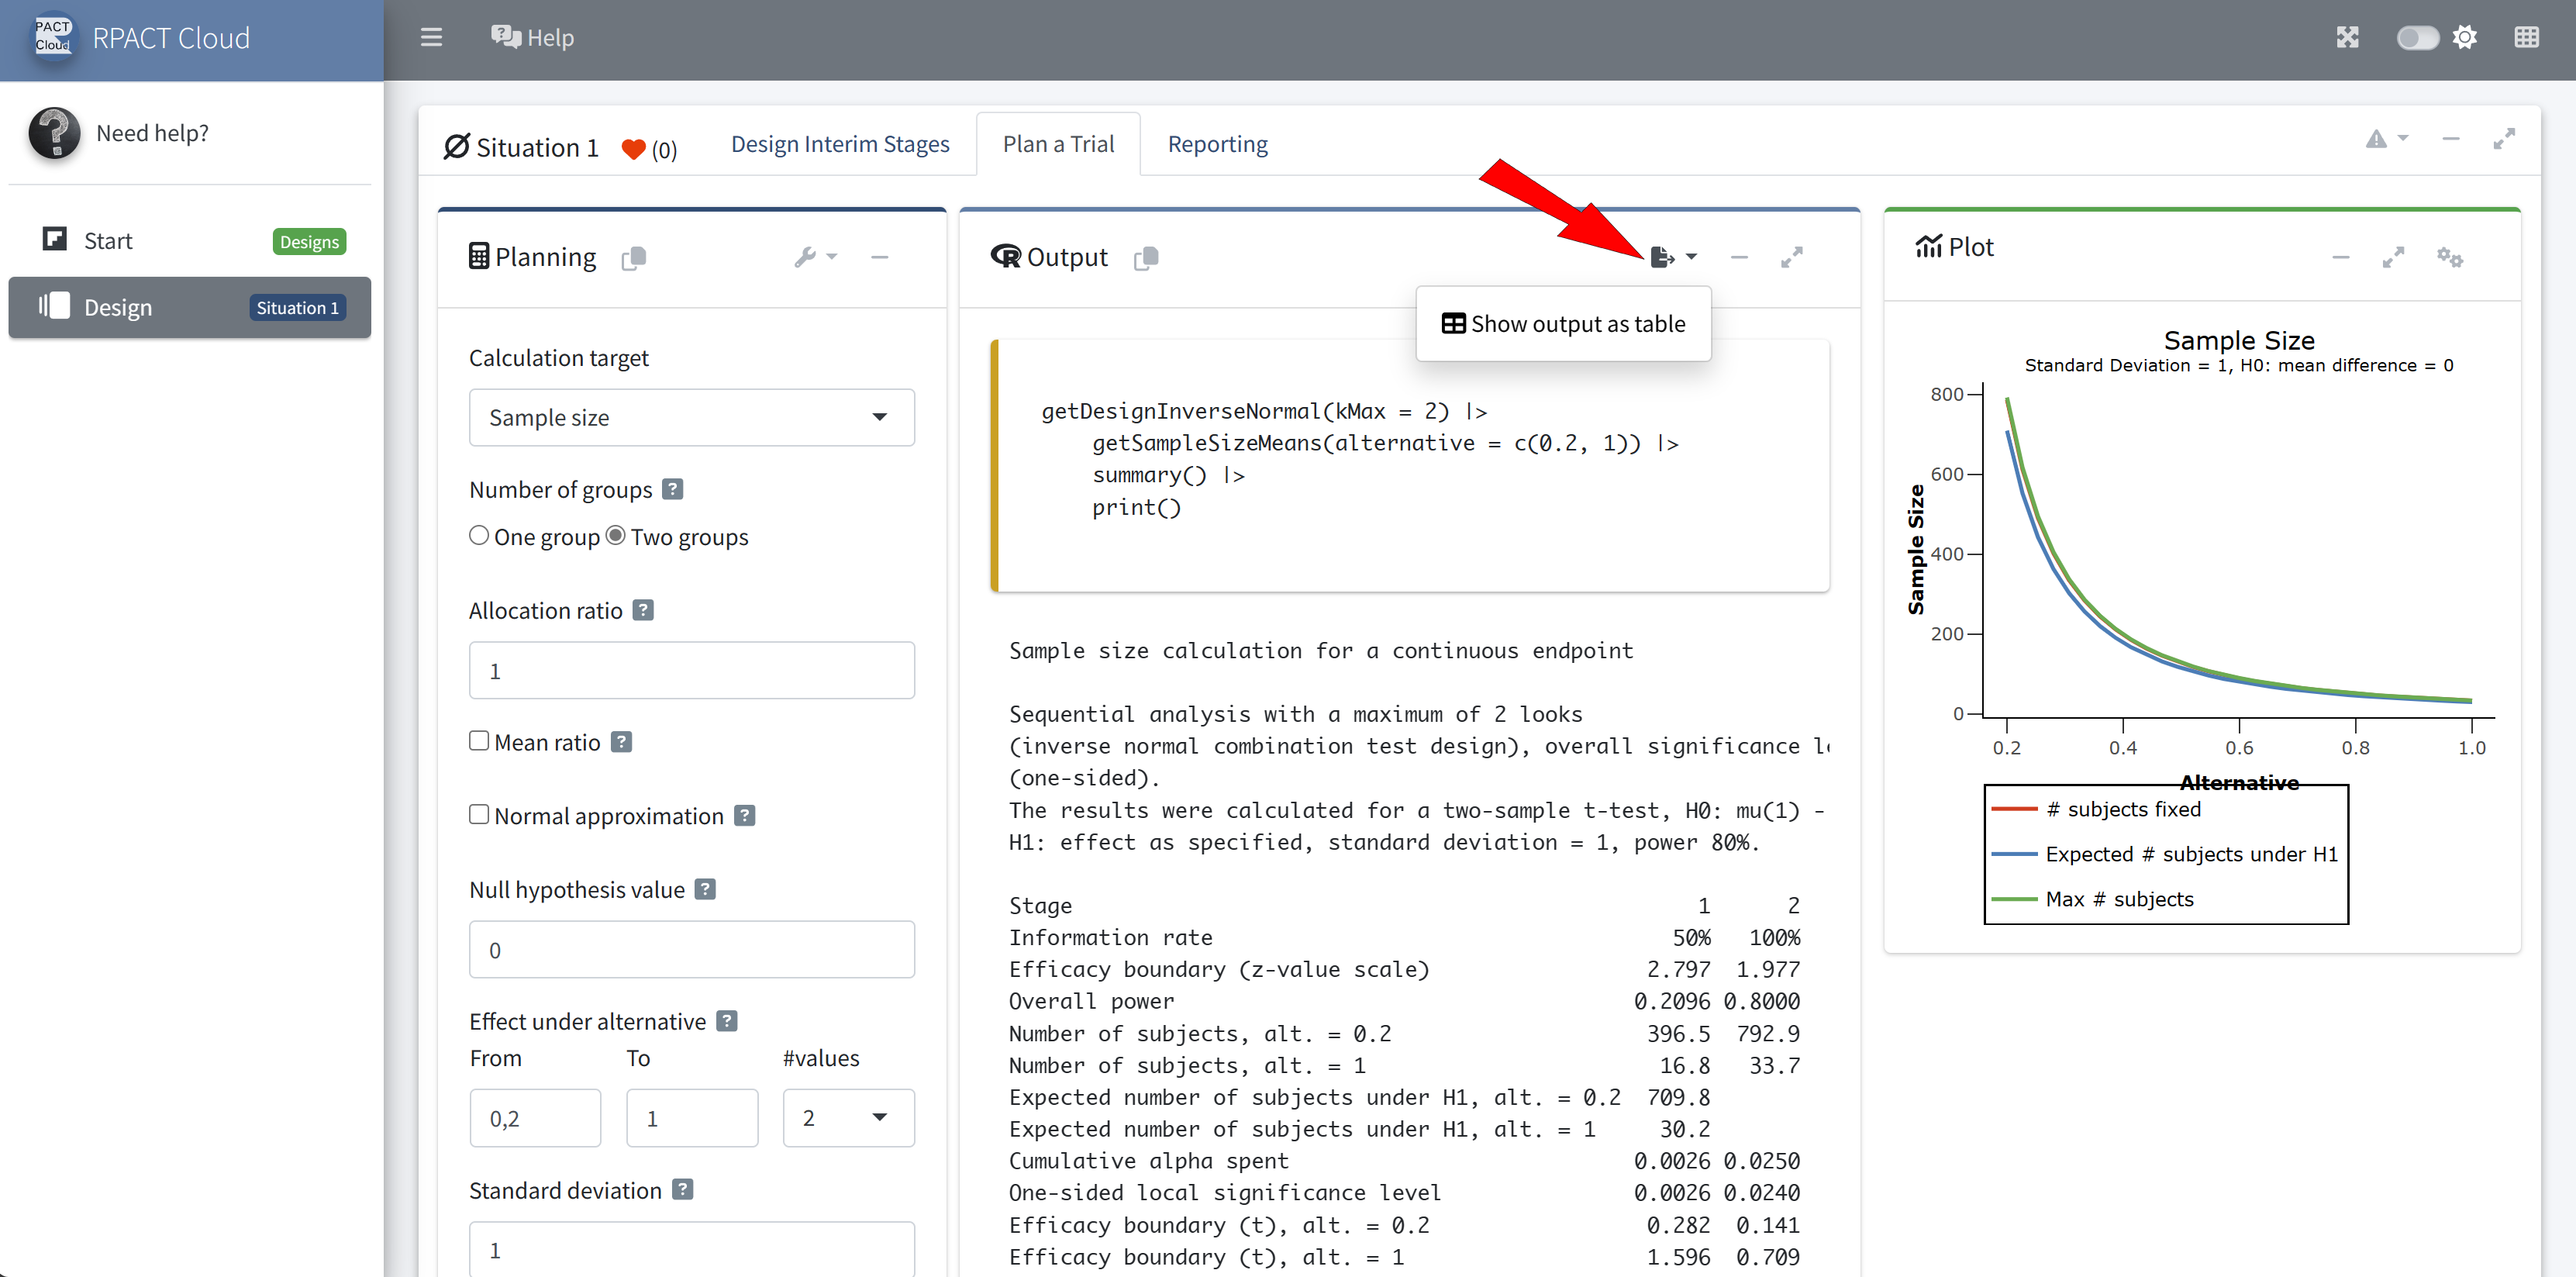
RPACT Cloud – Output Options
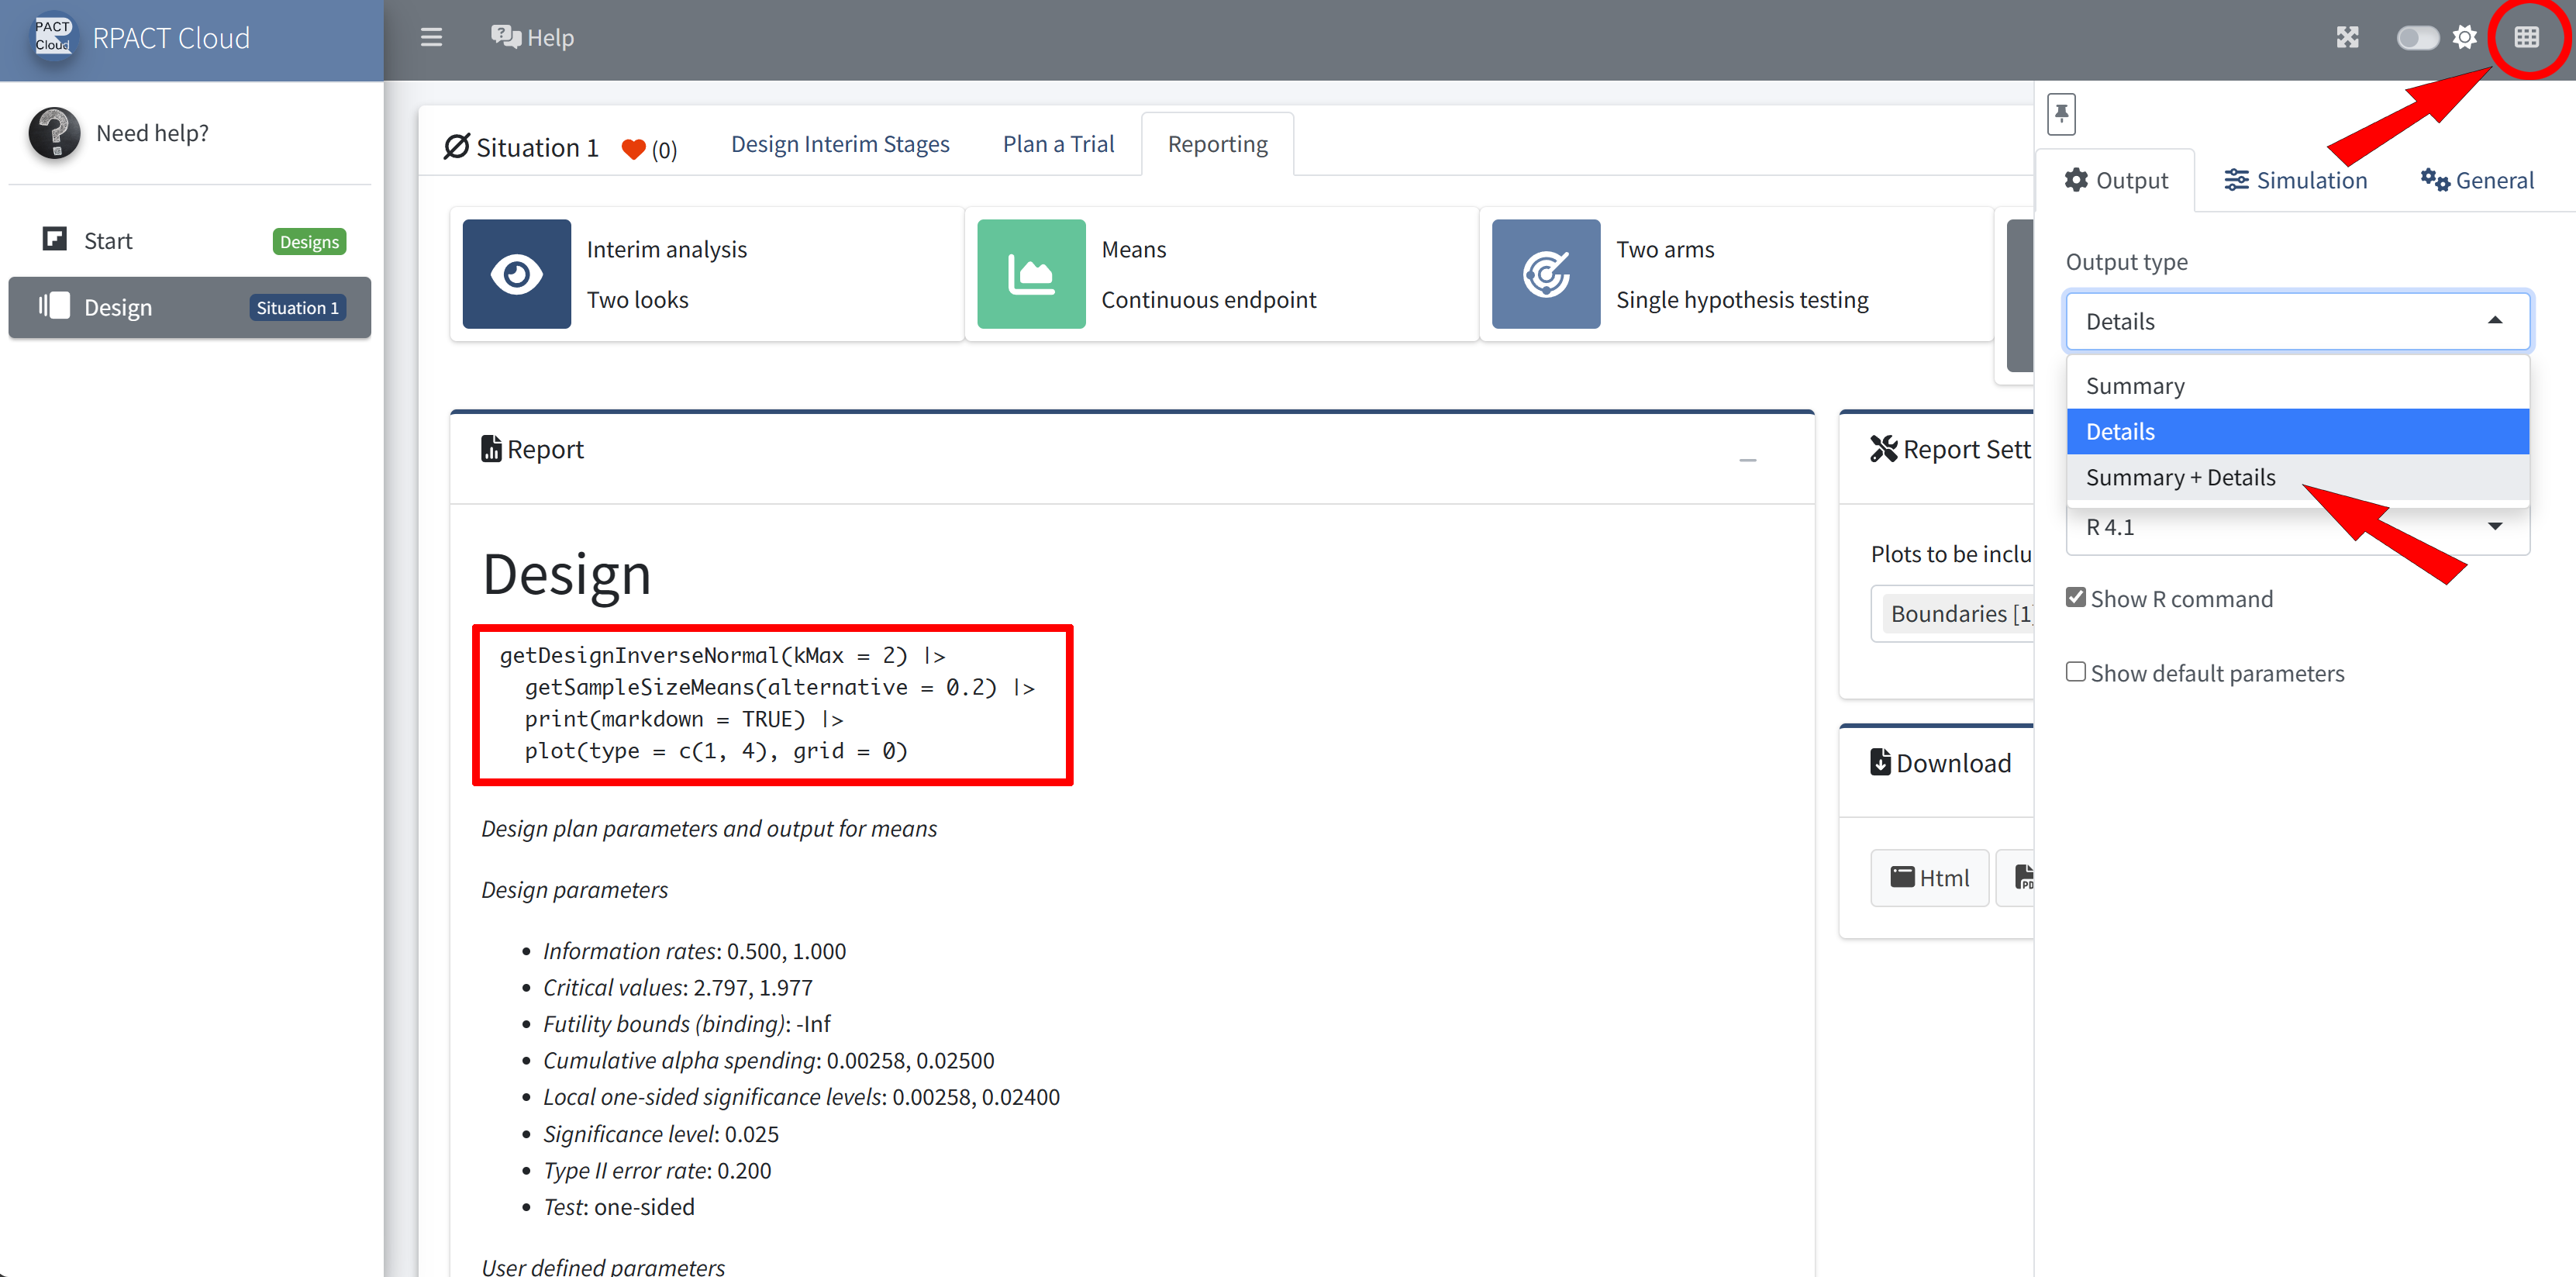
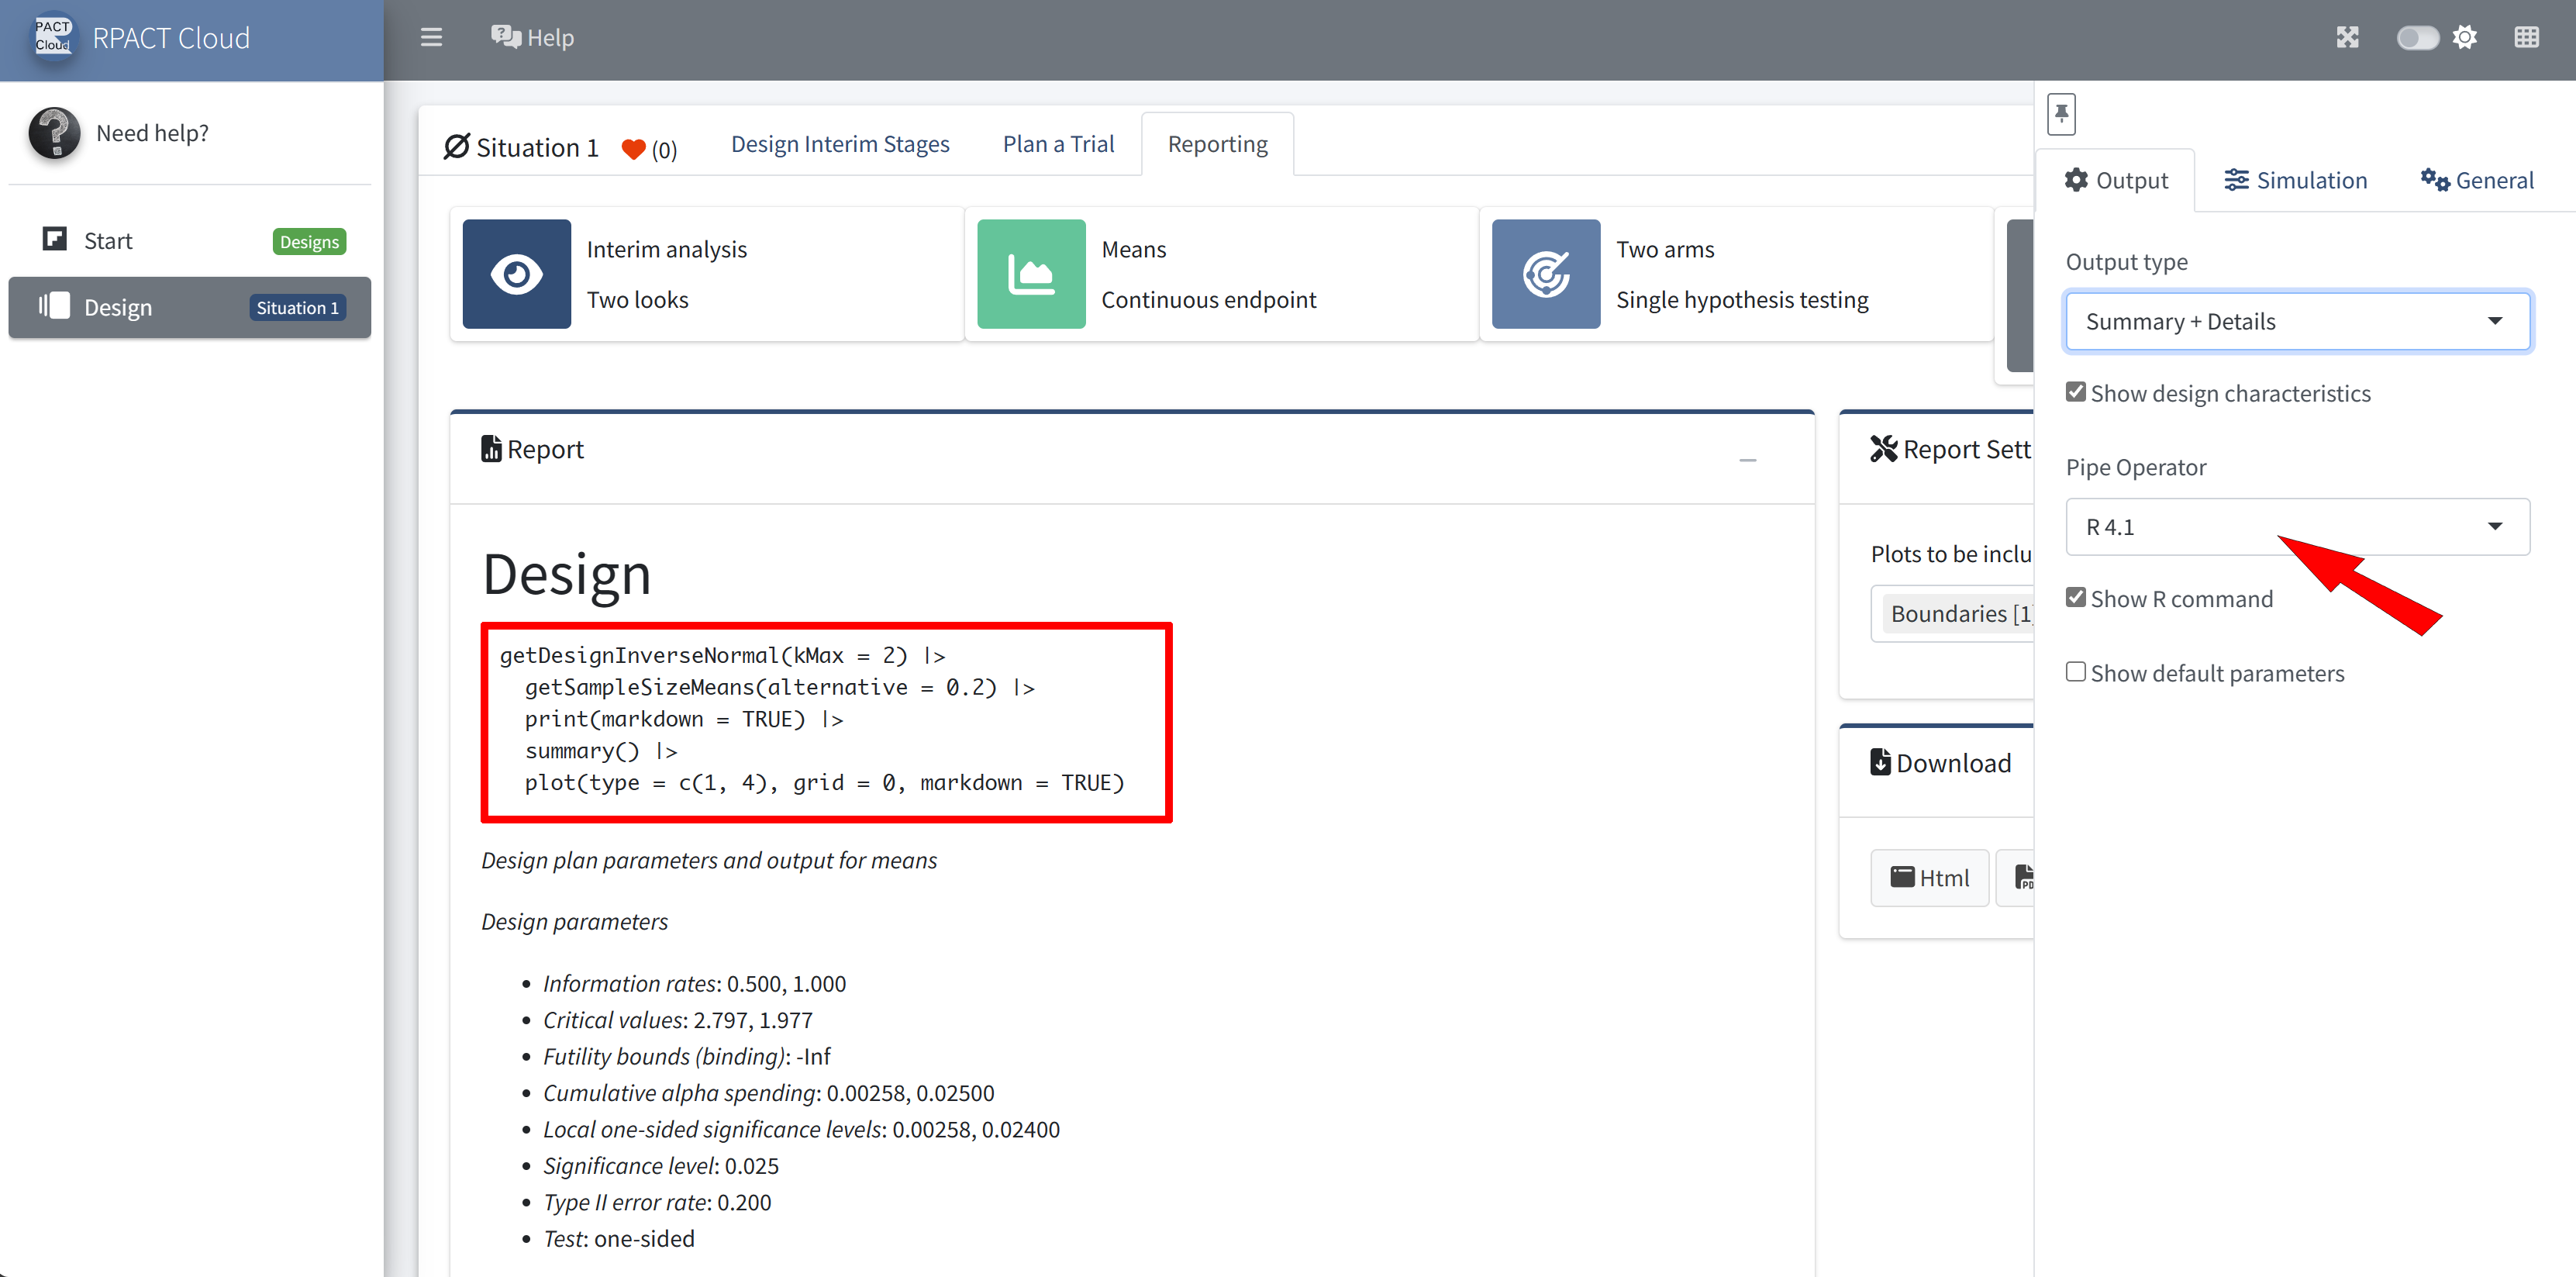
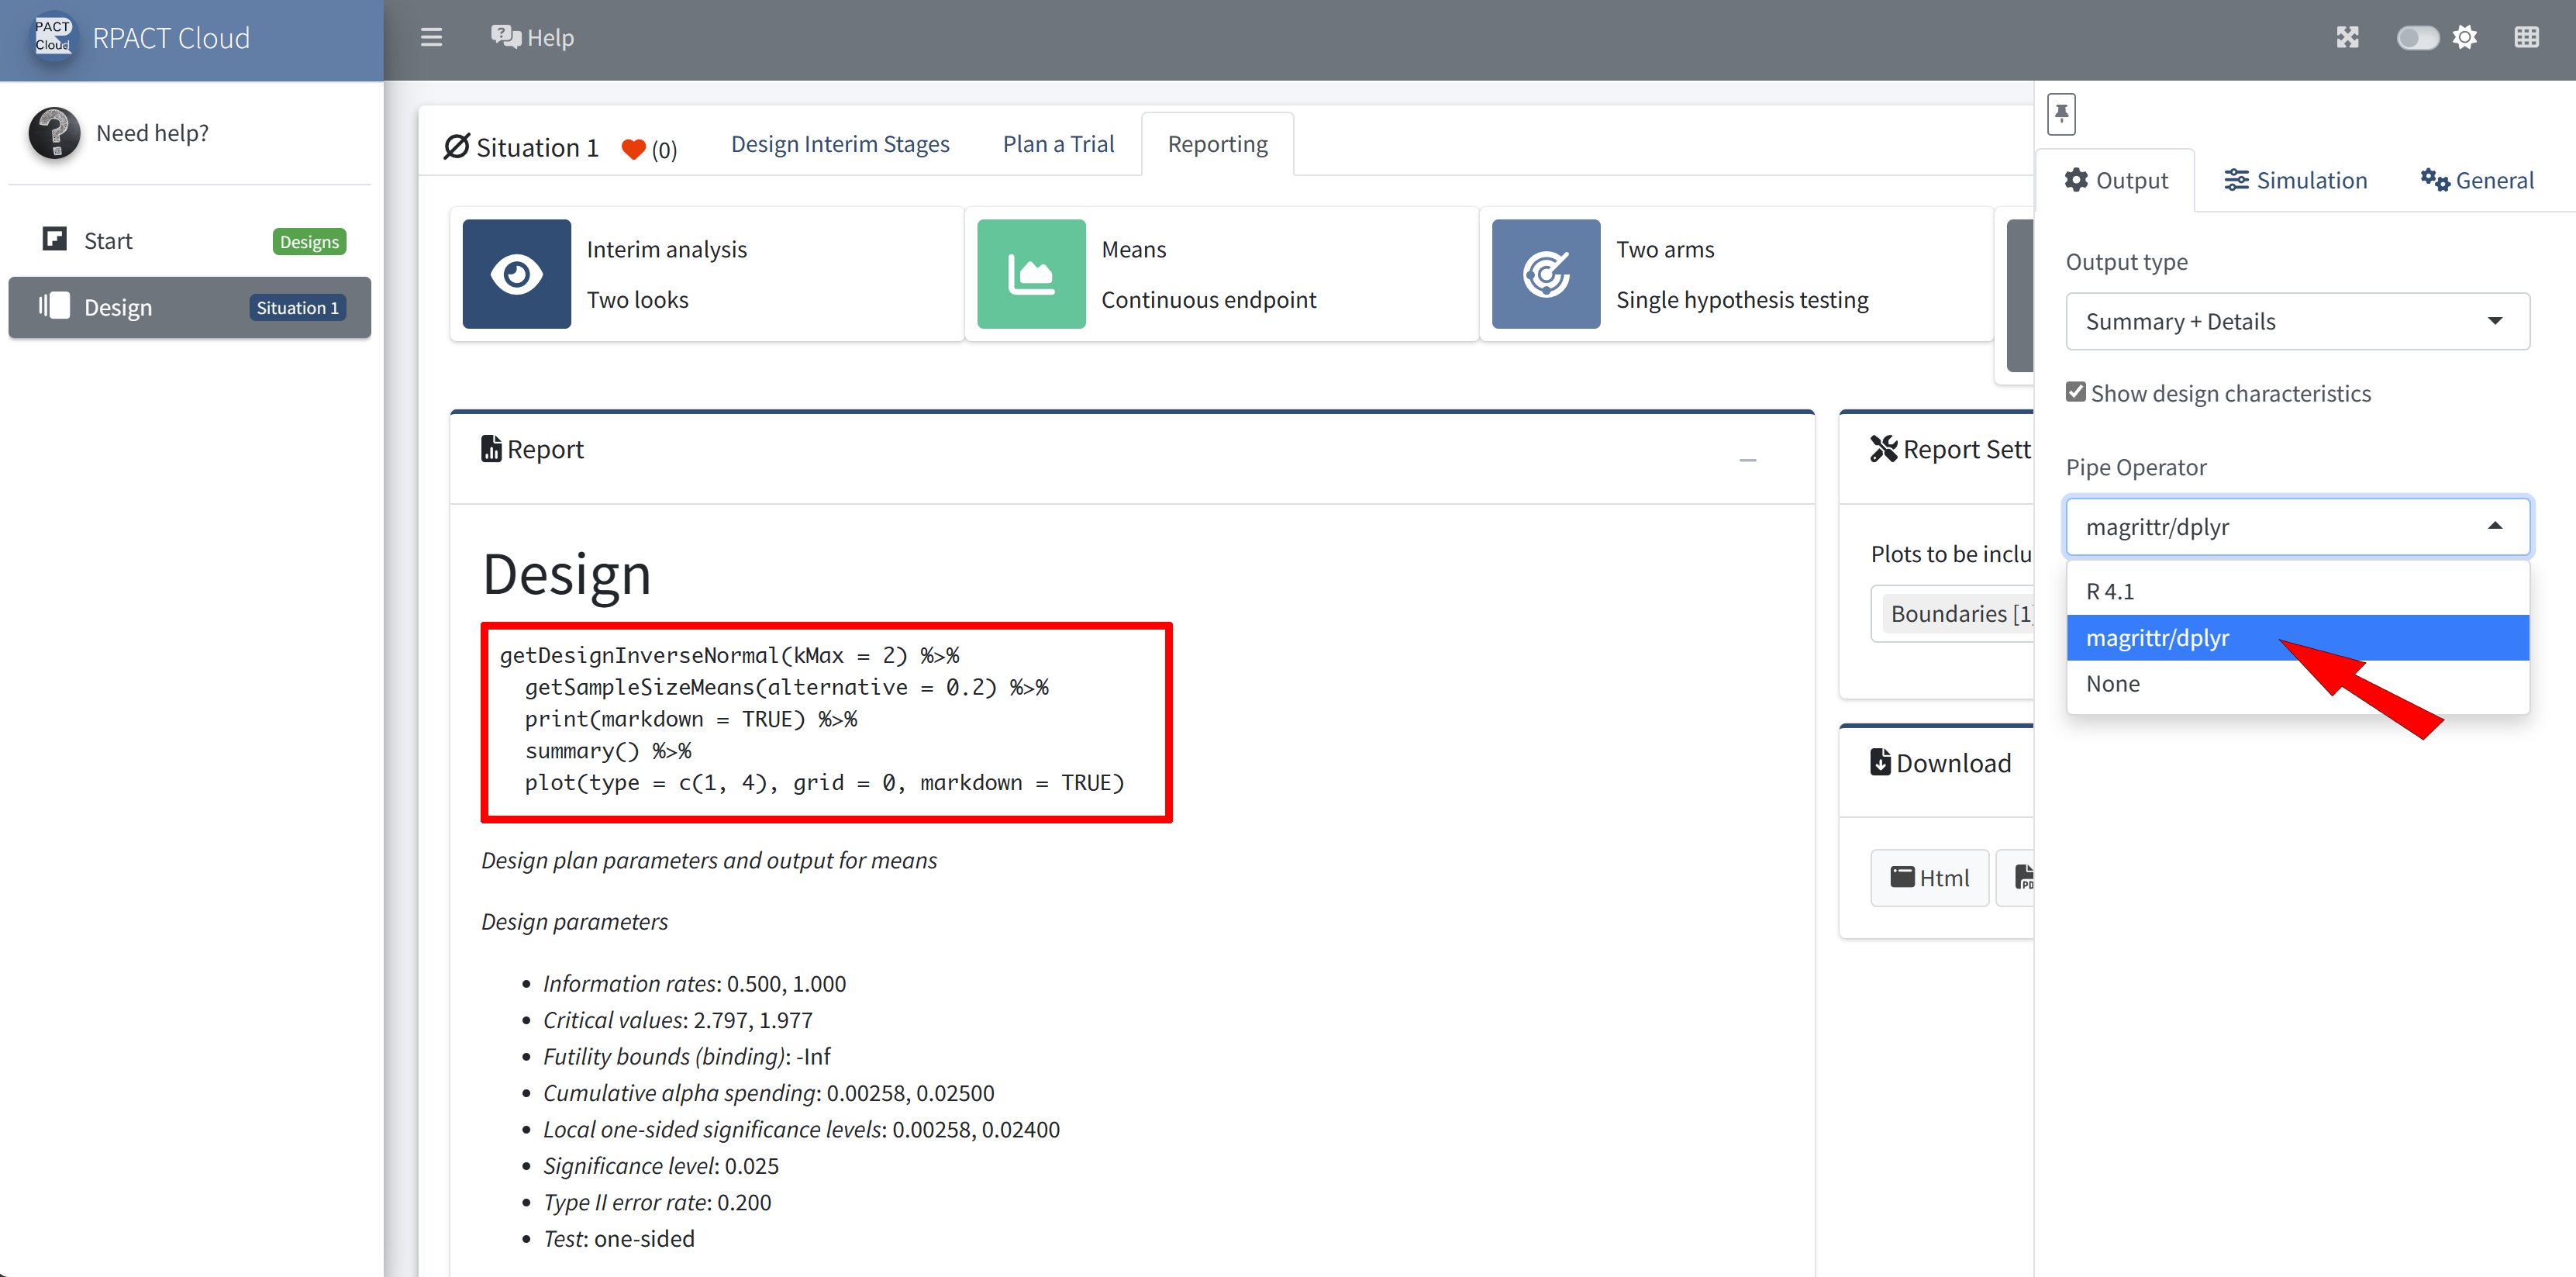
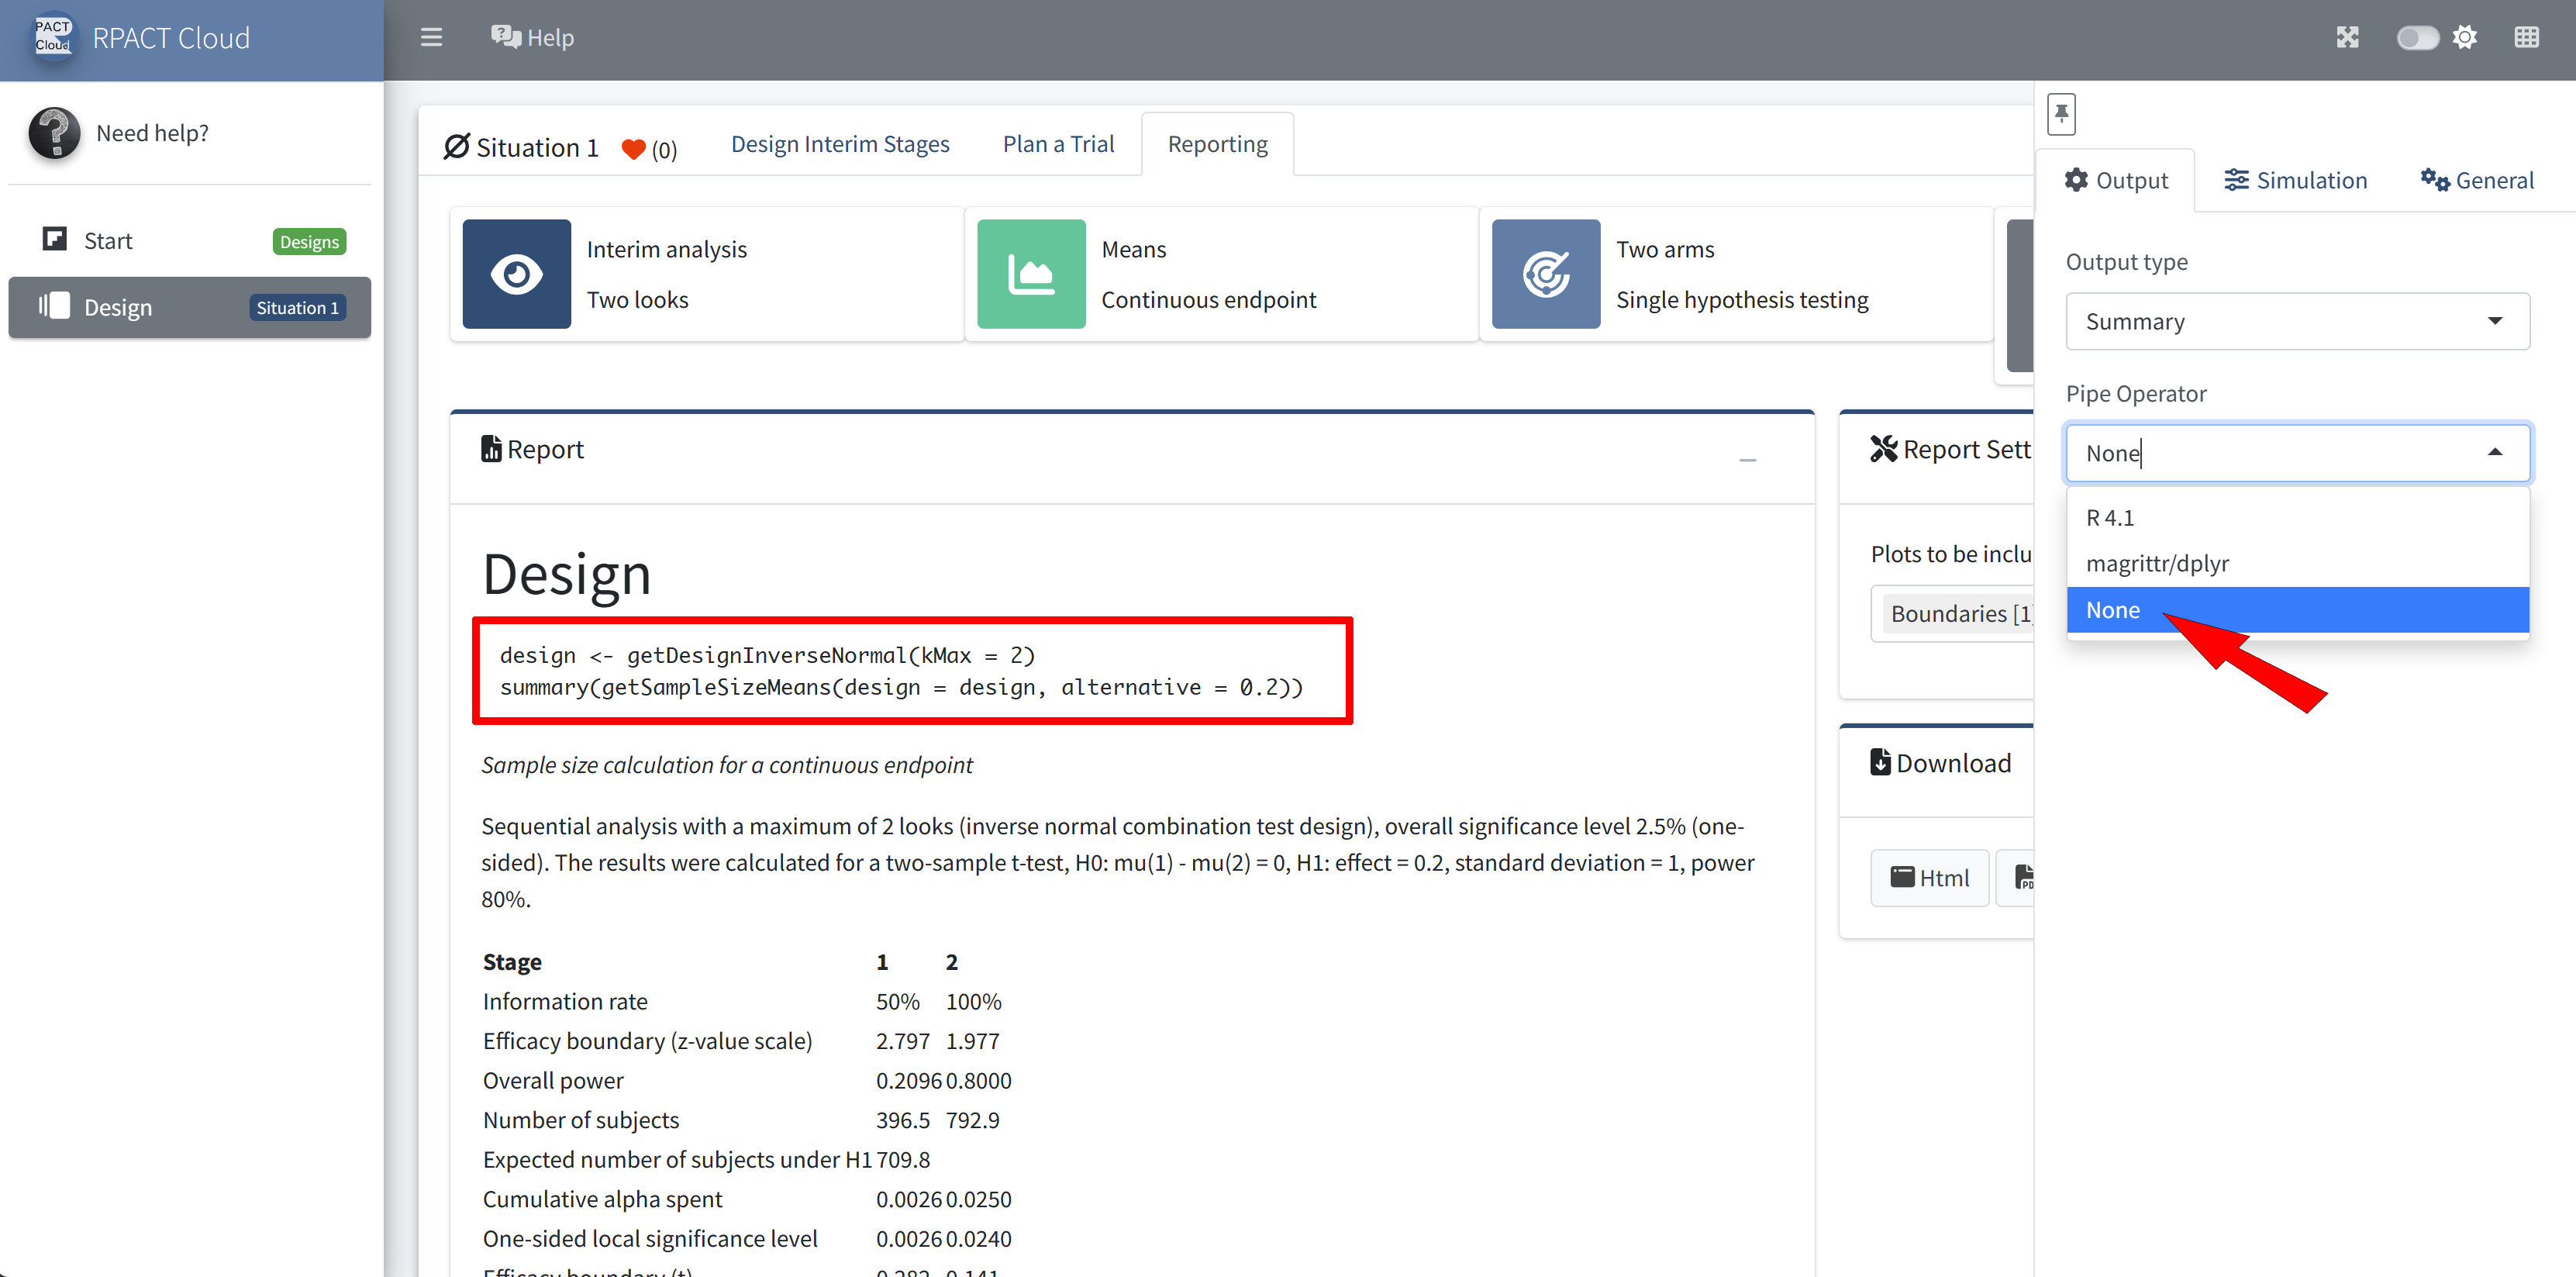
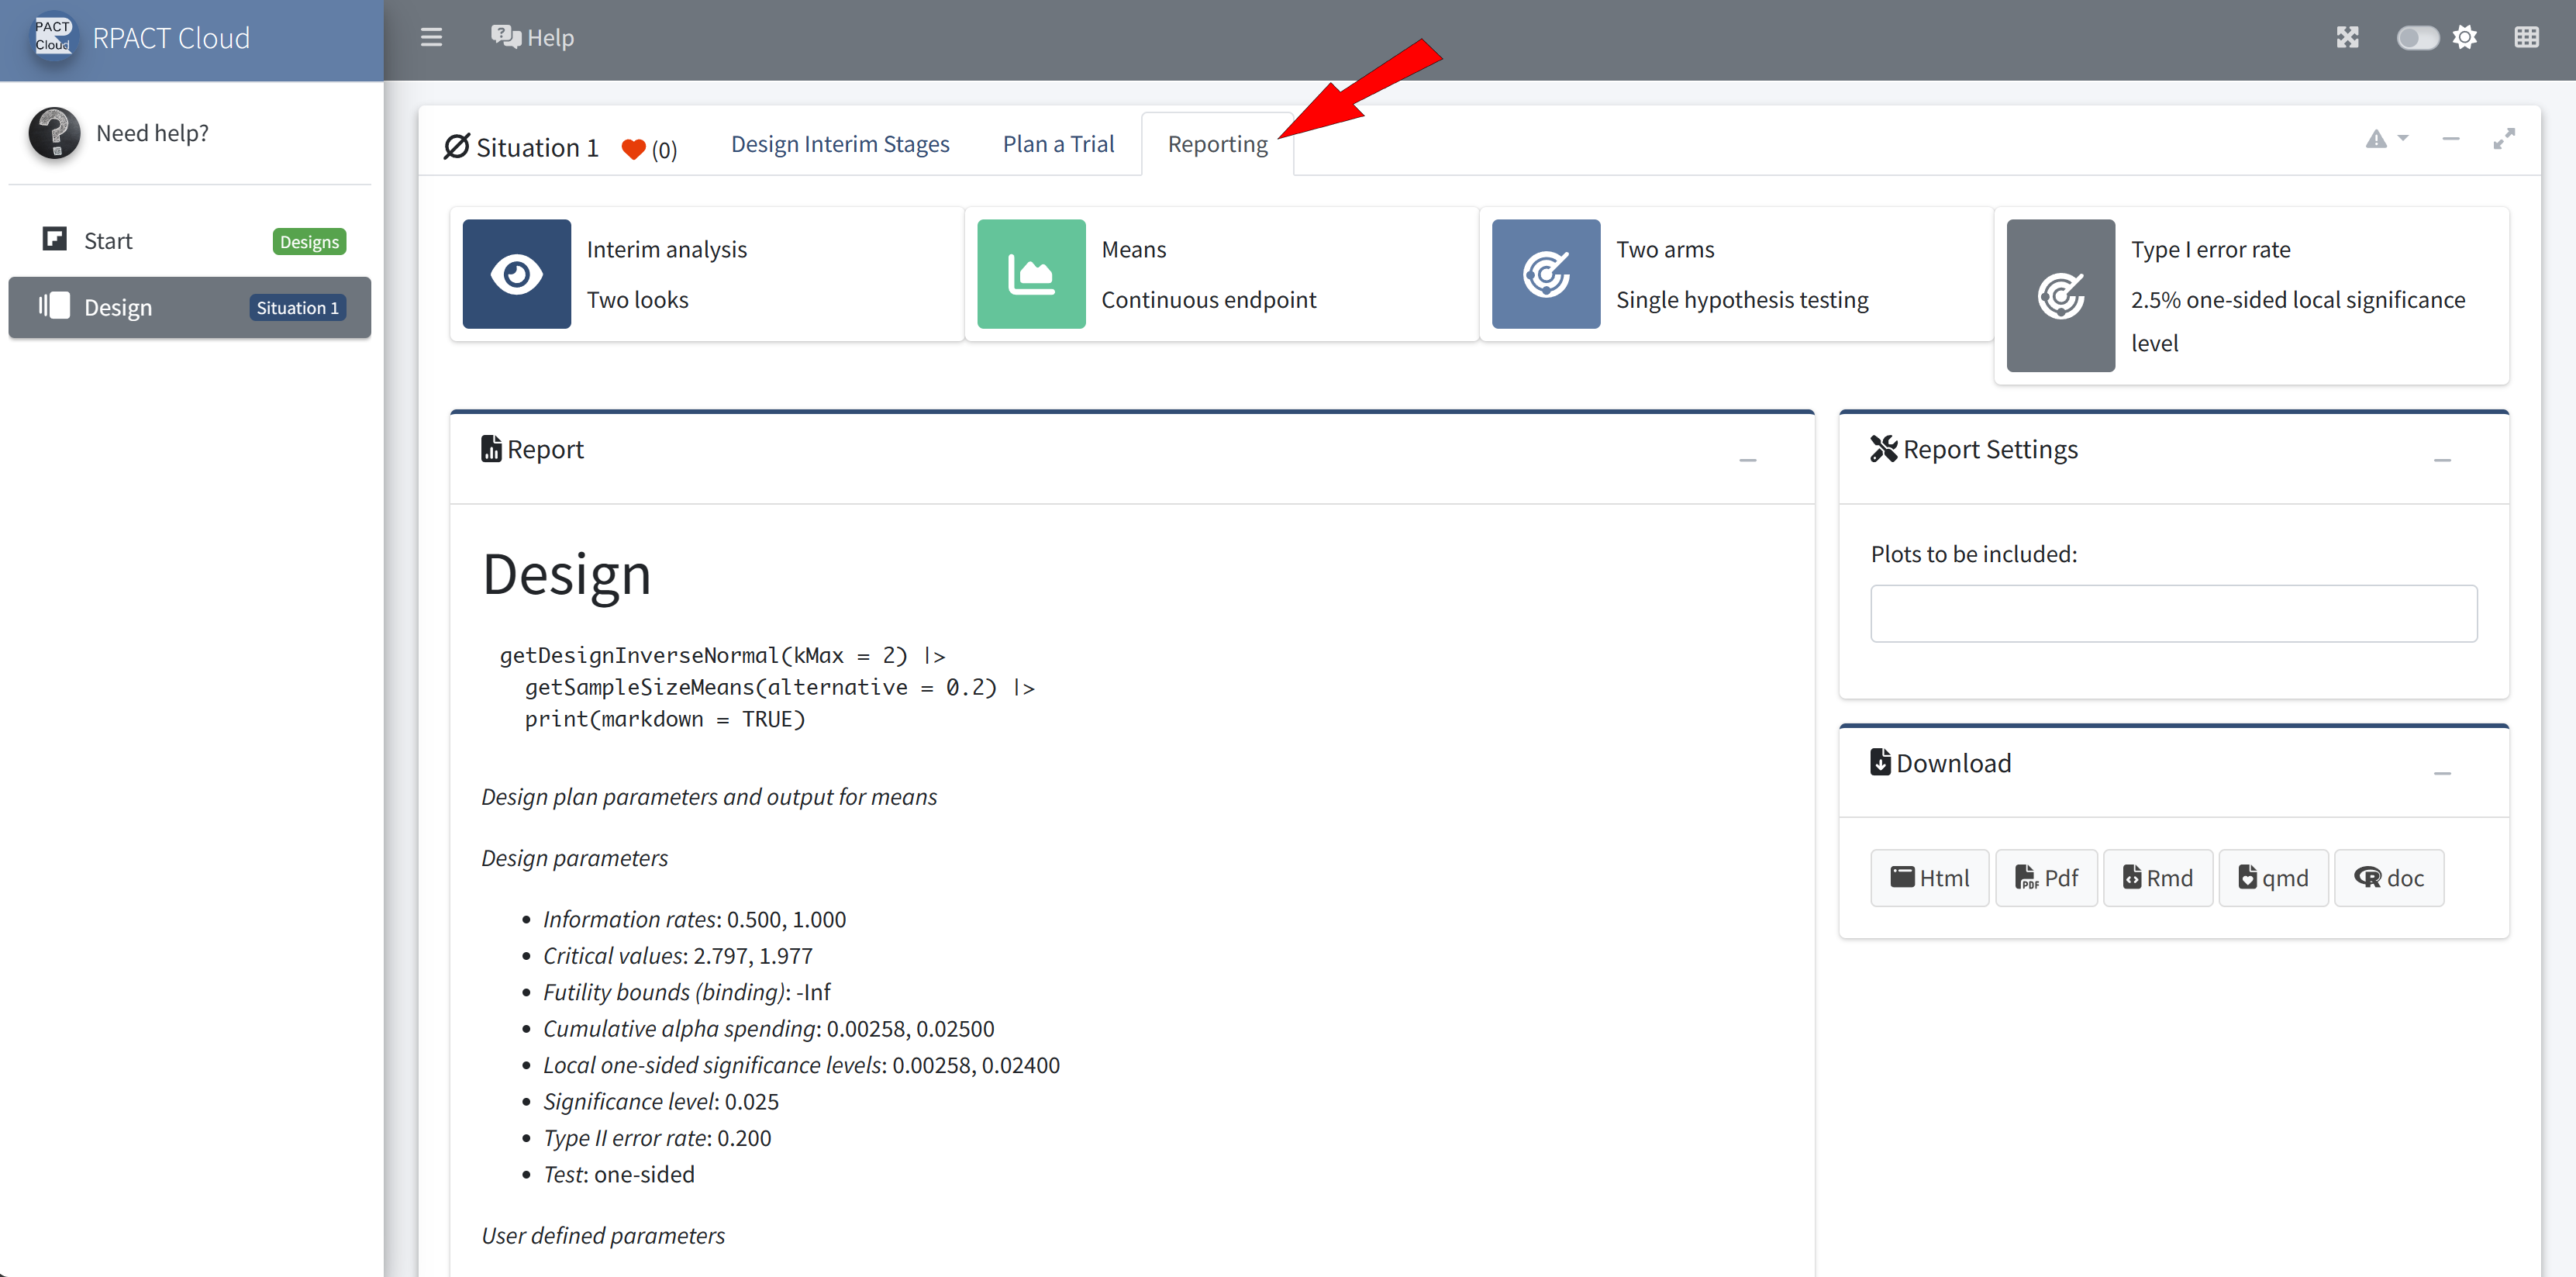
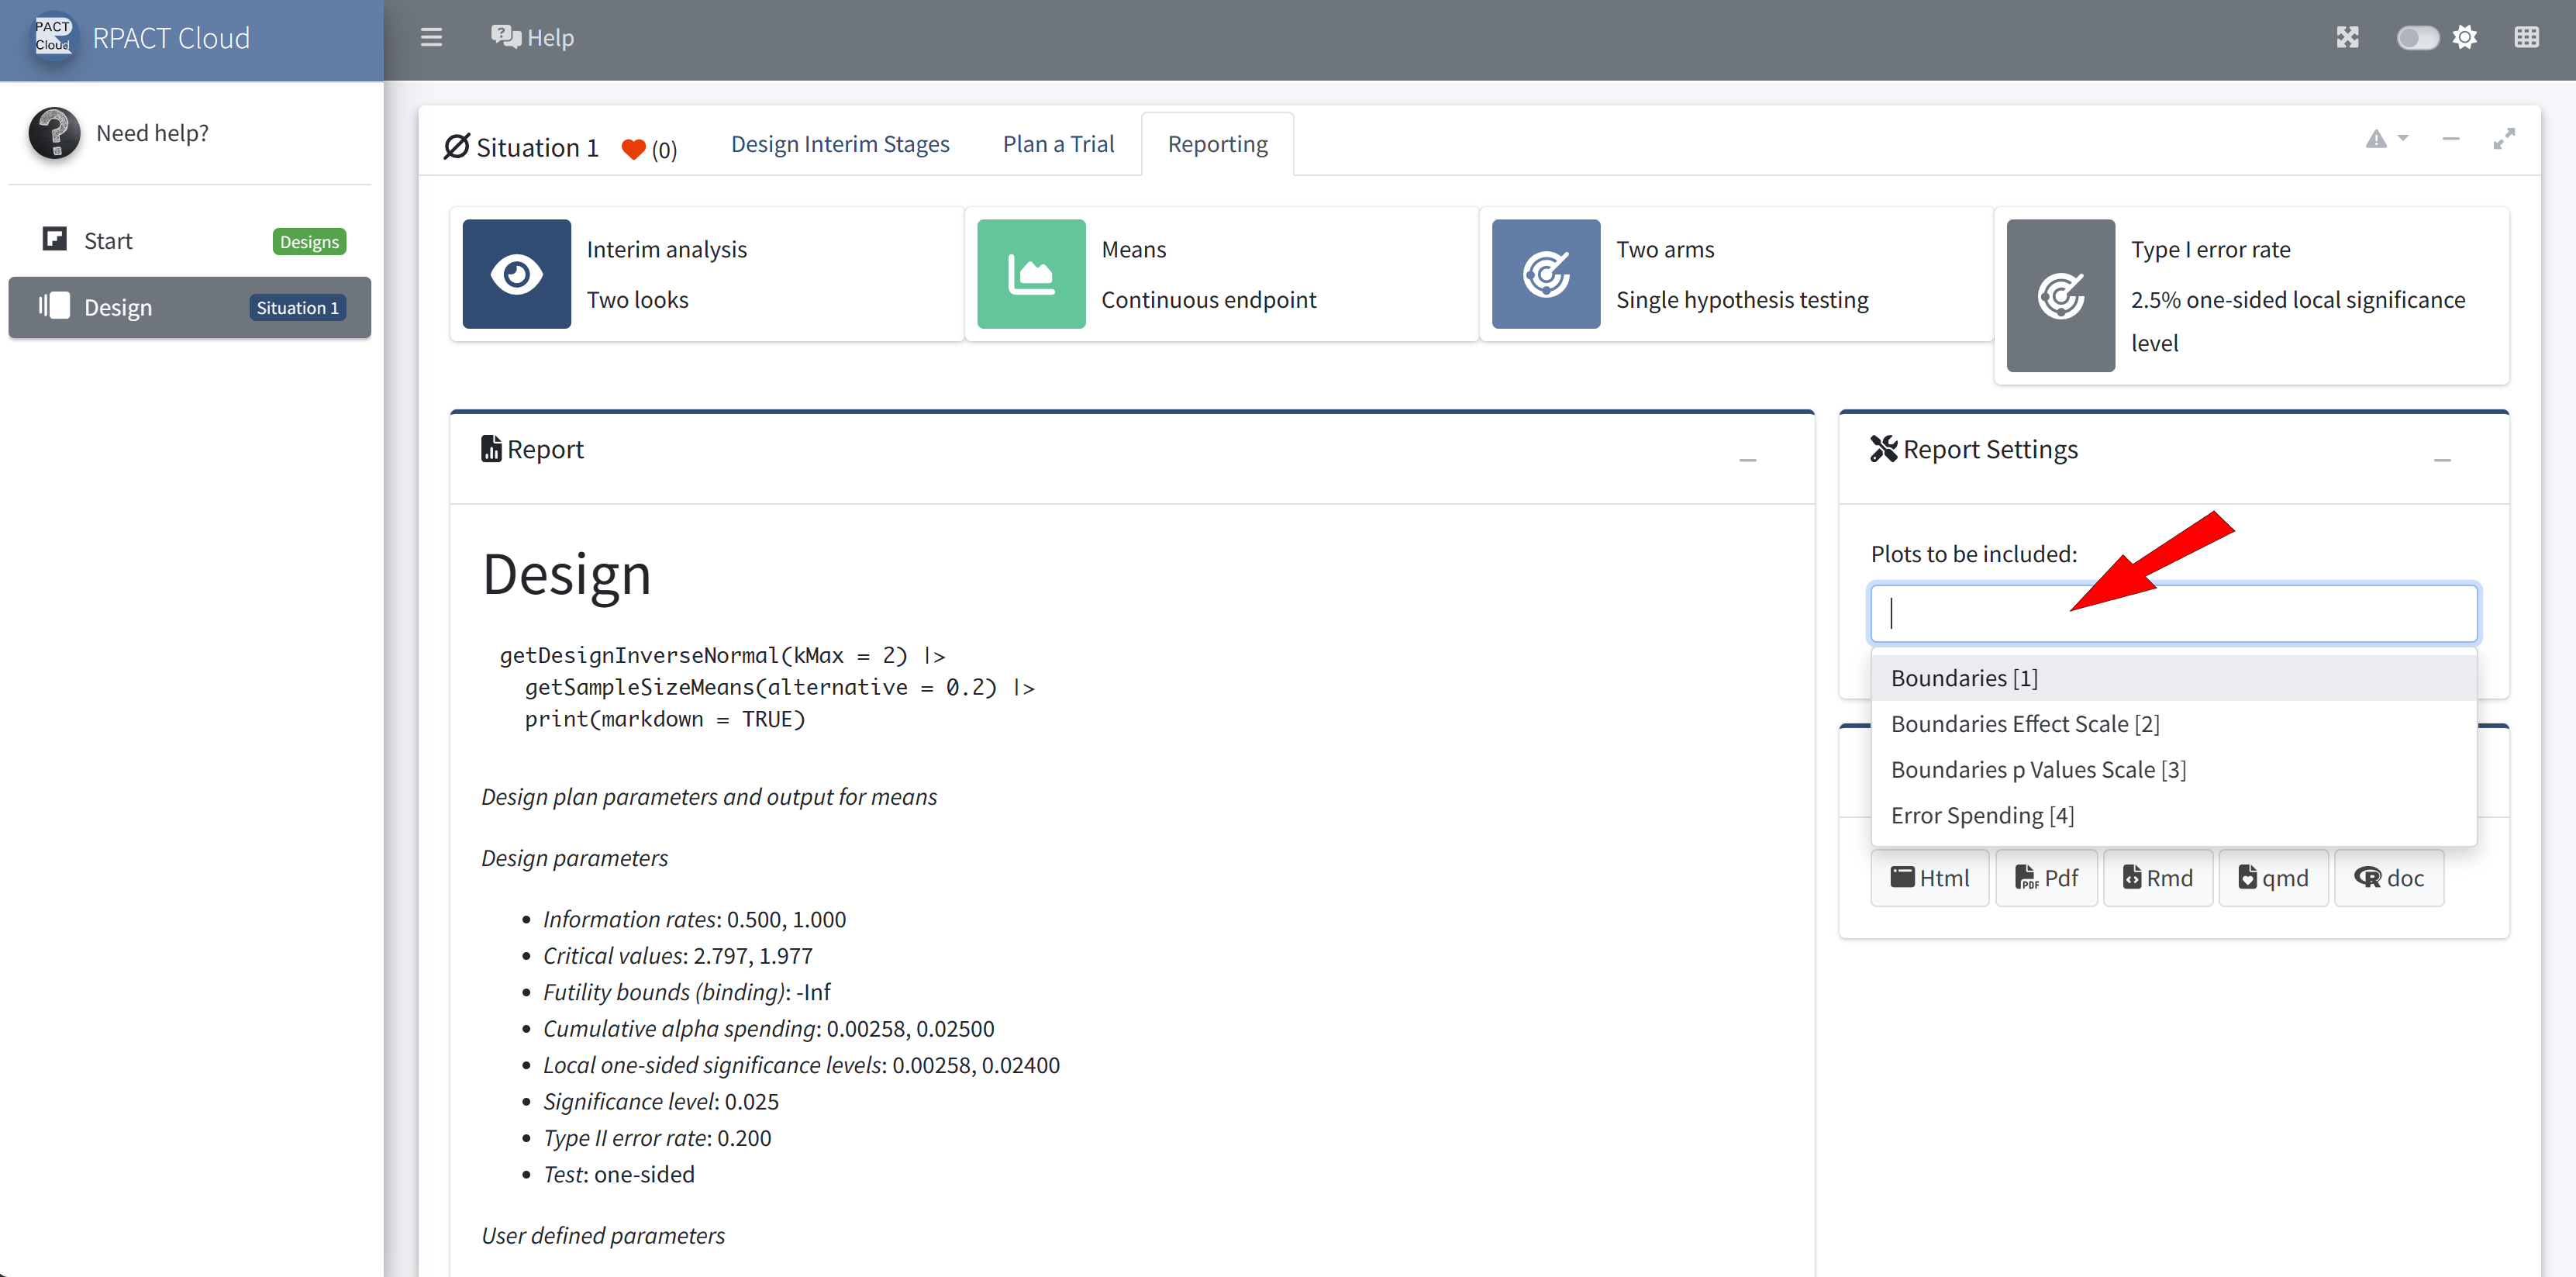
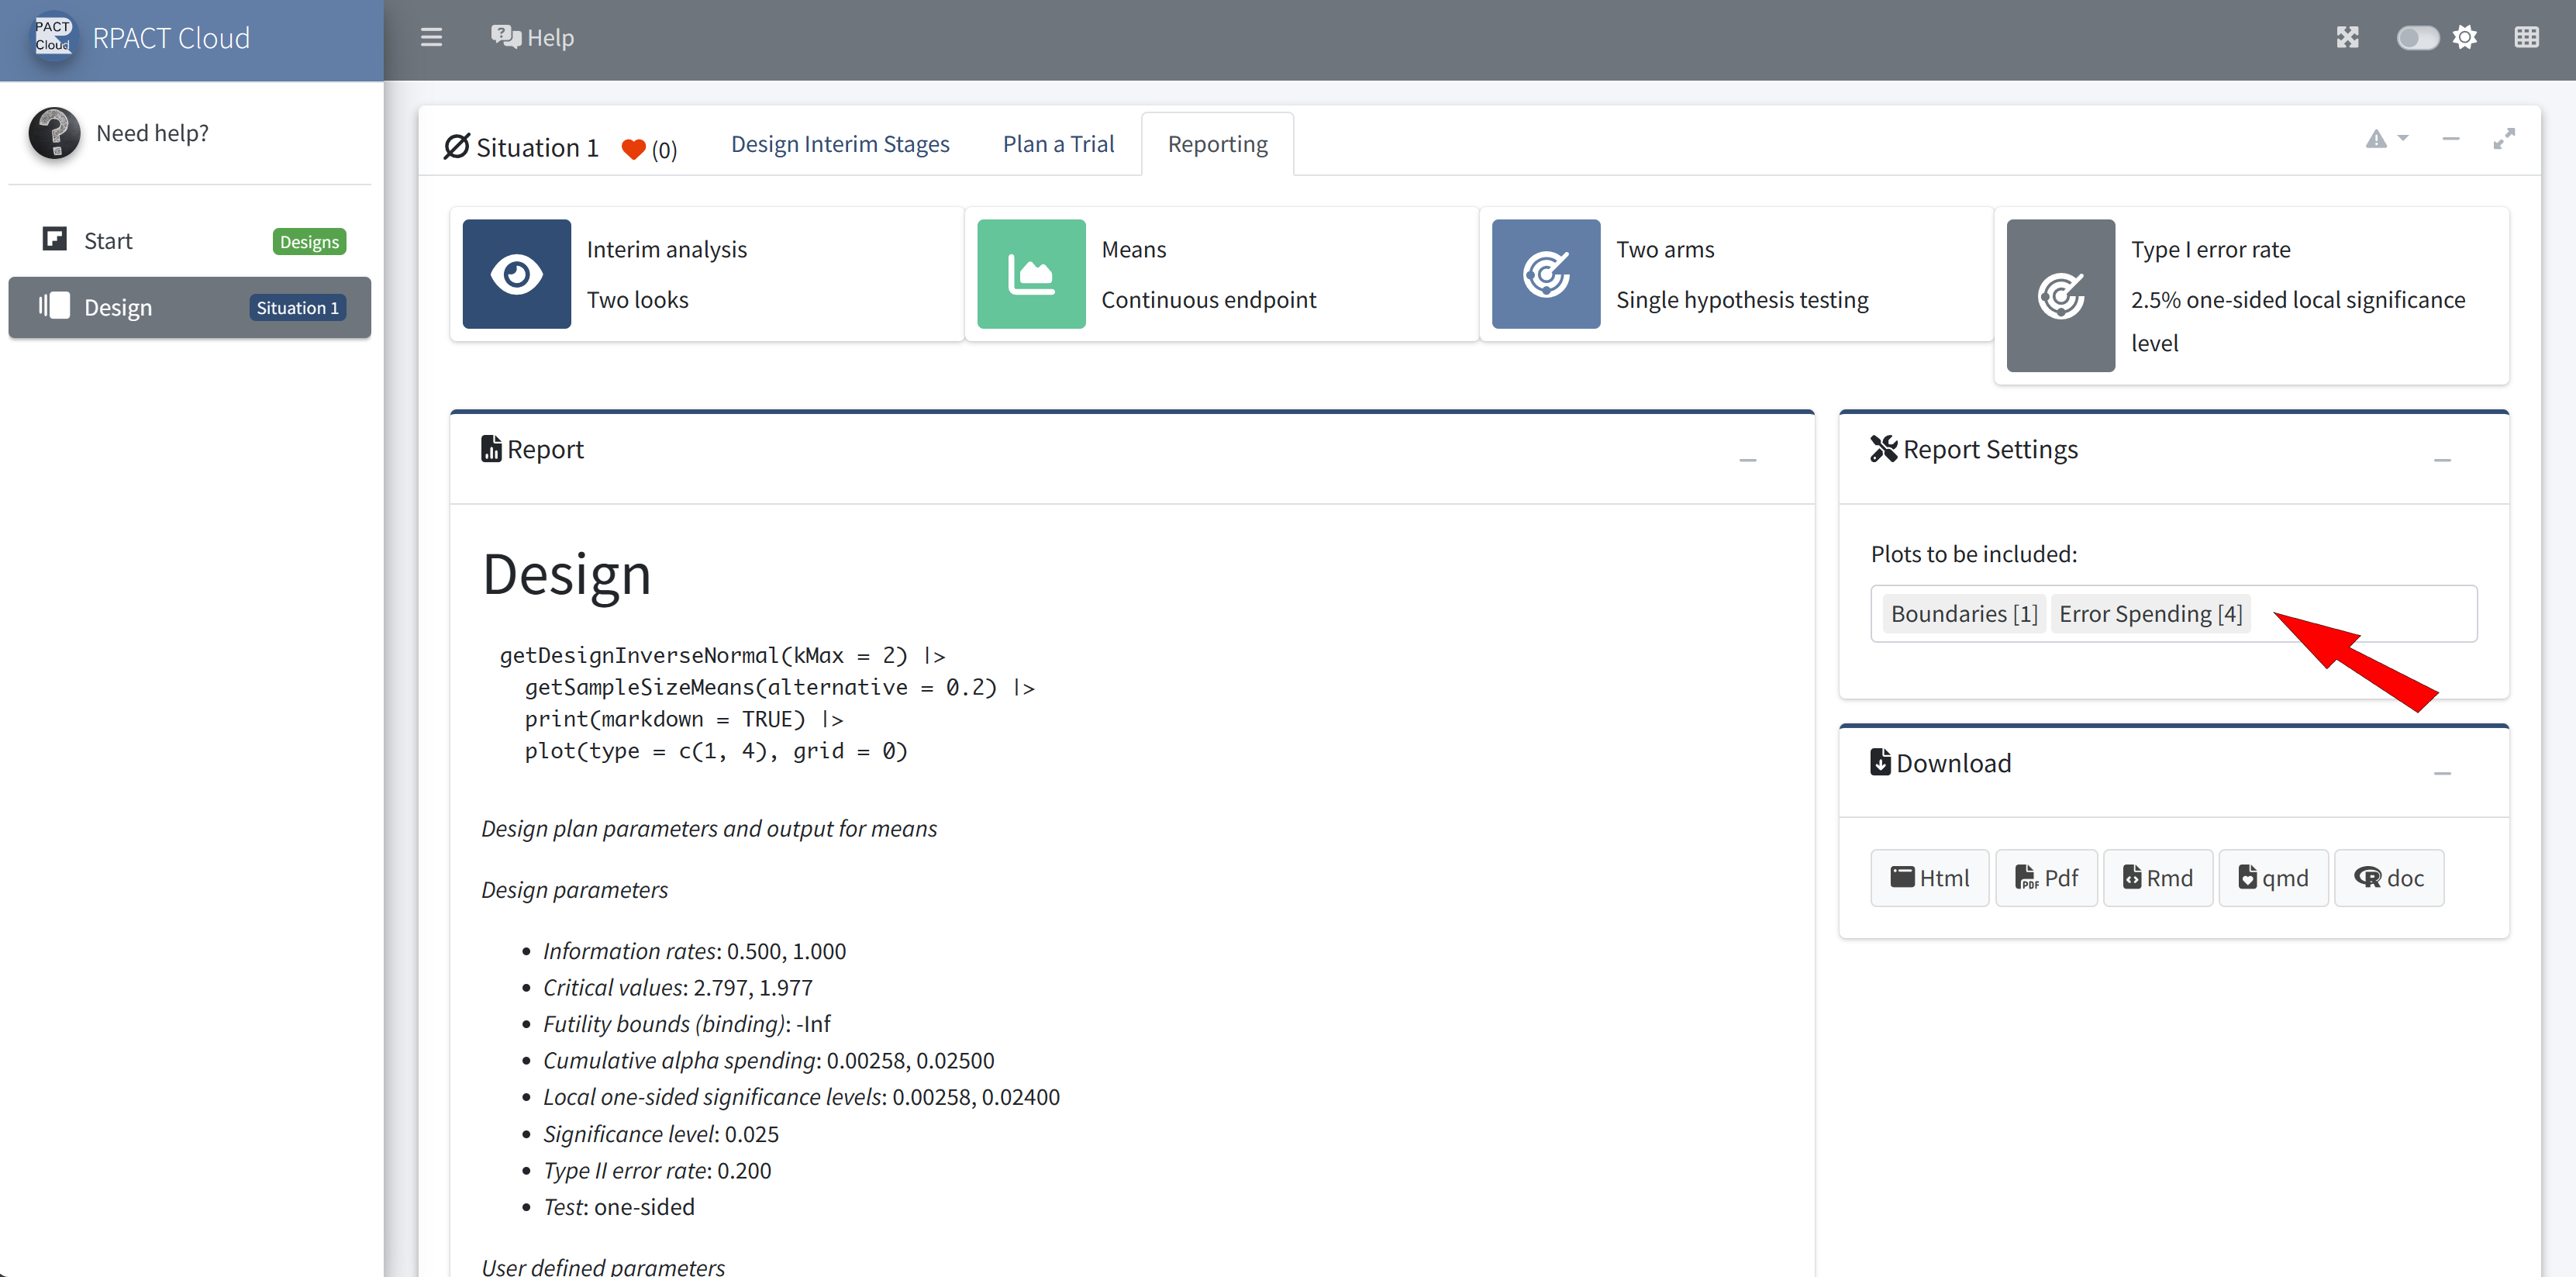
RPACT Cloud – Reporting
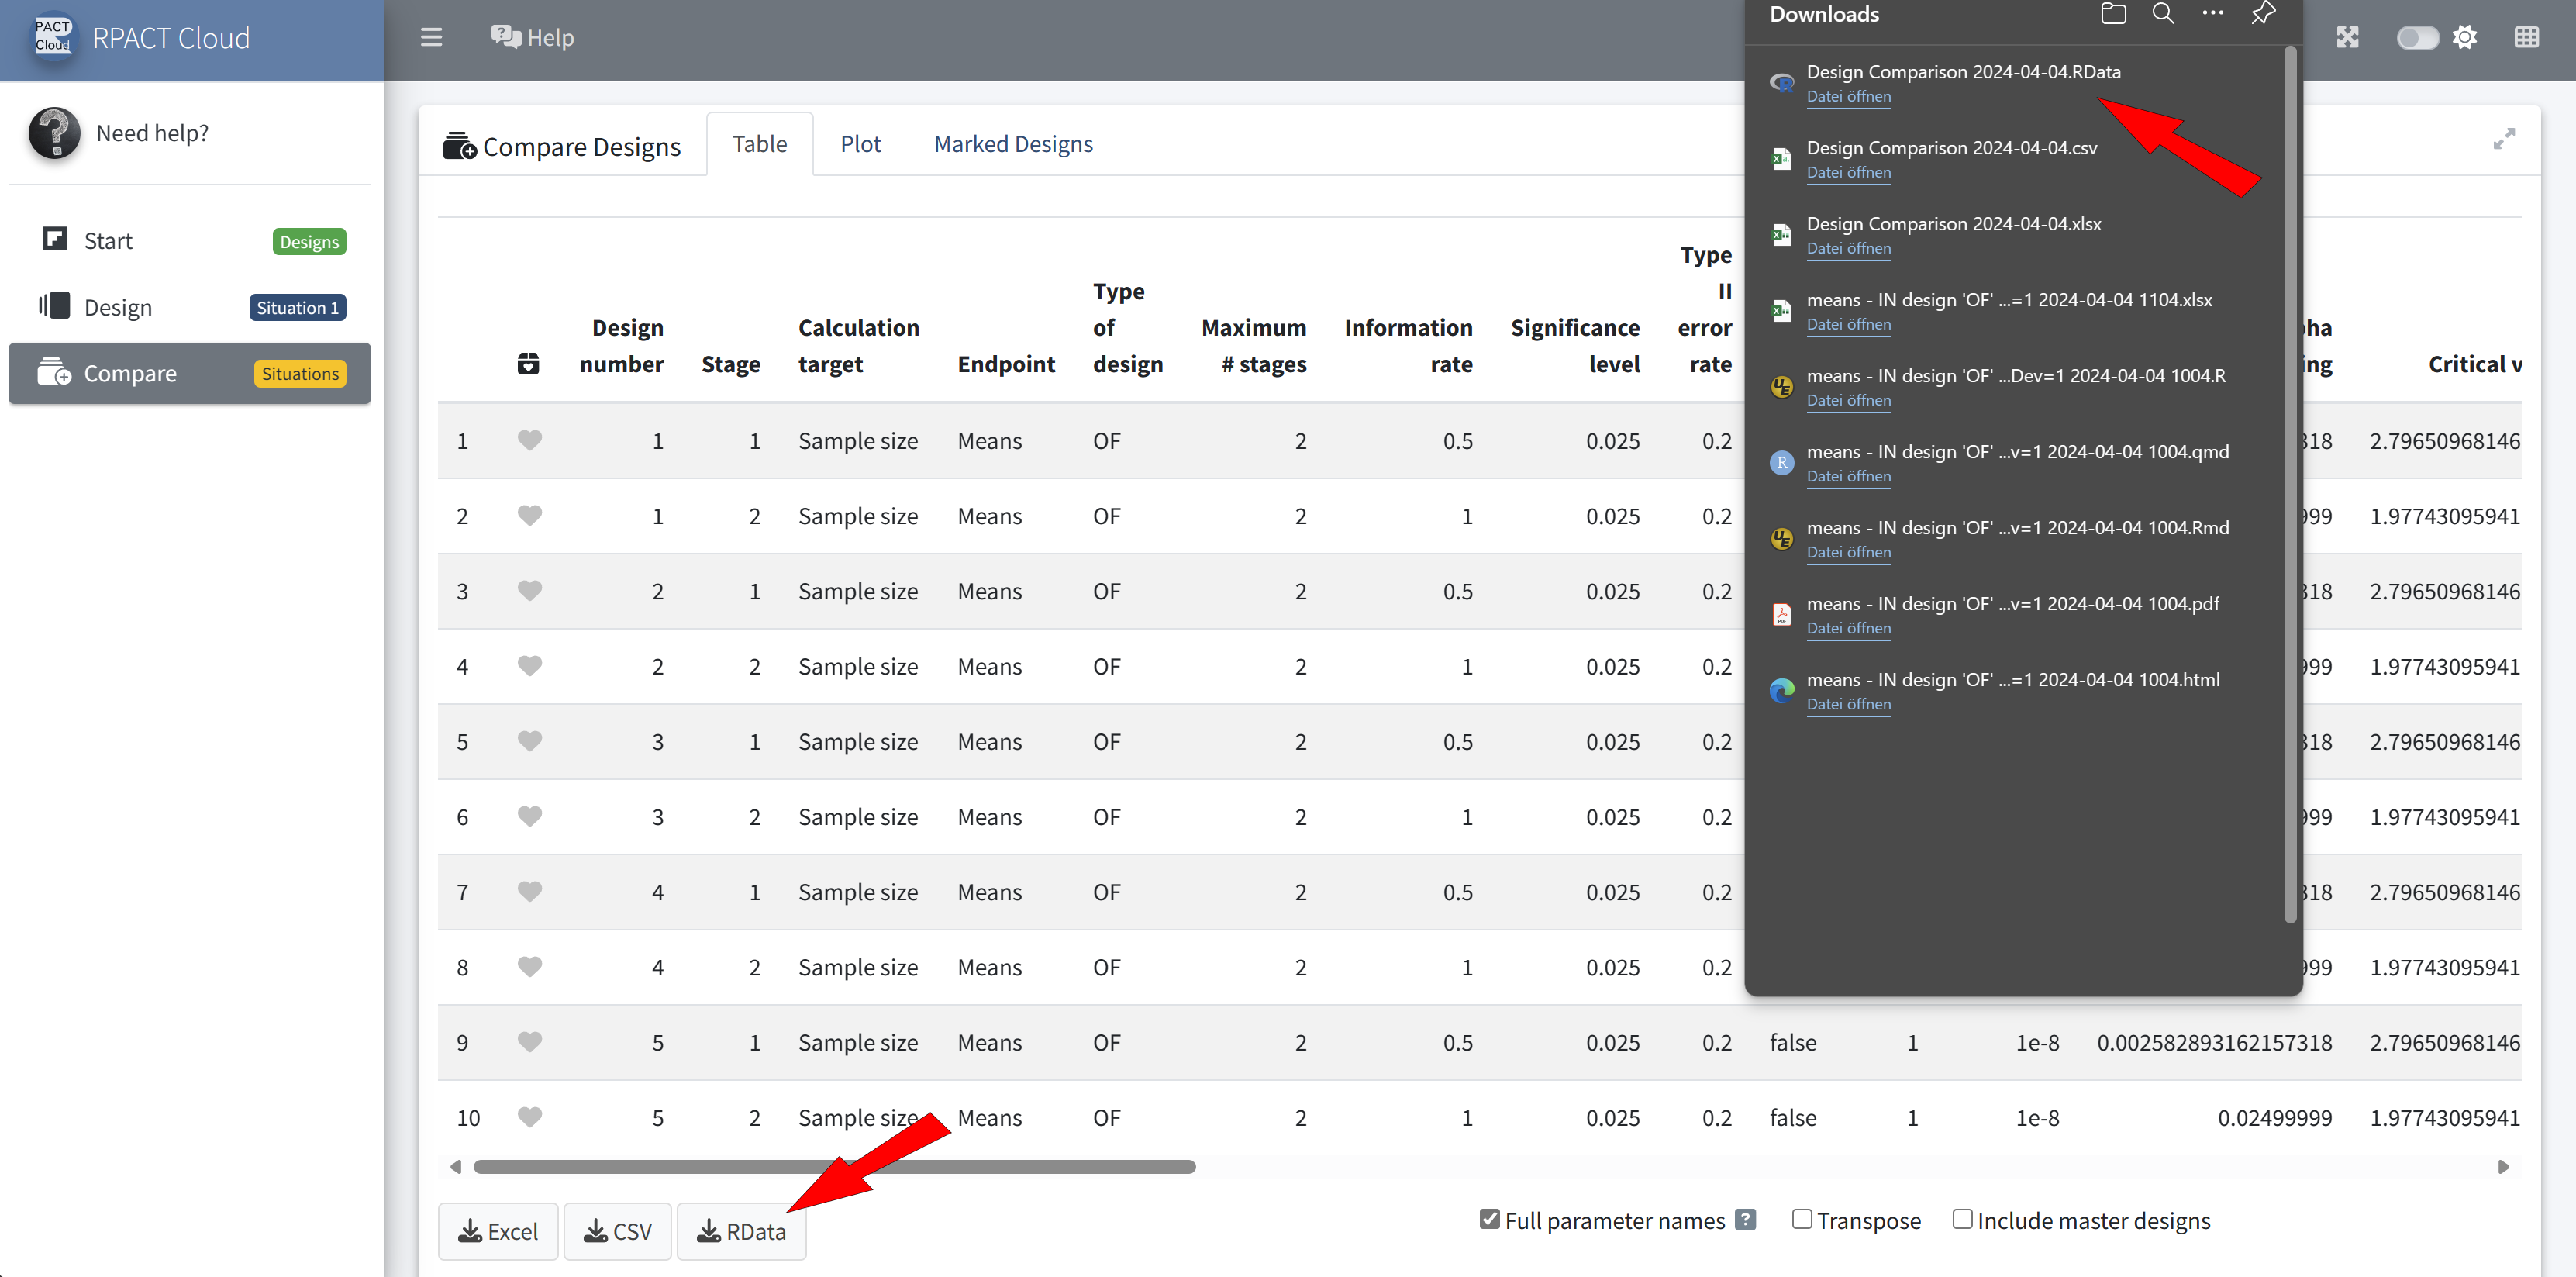
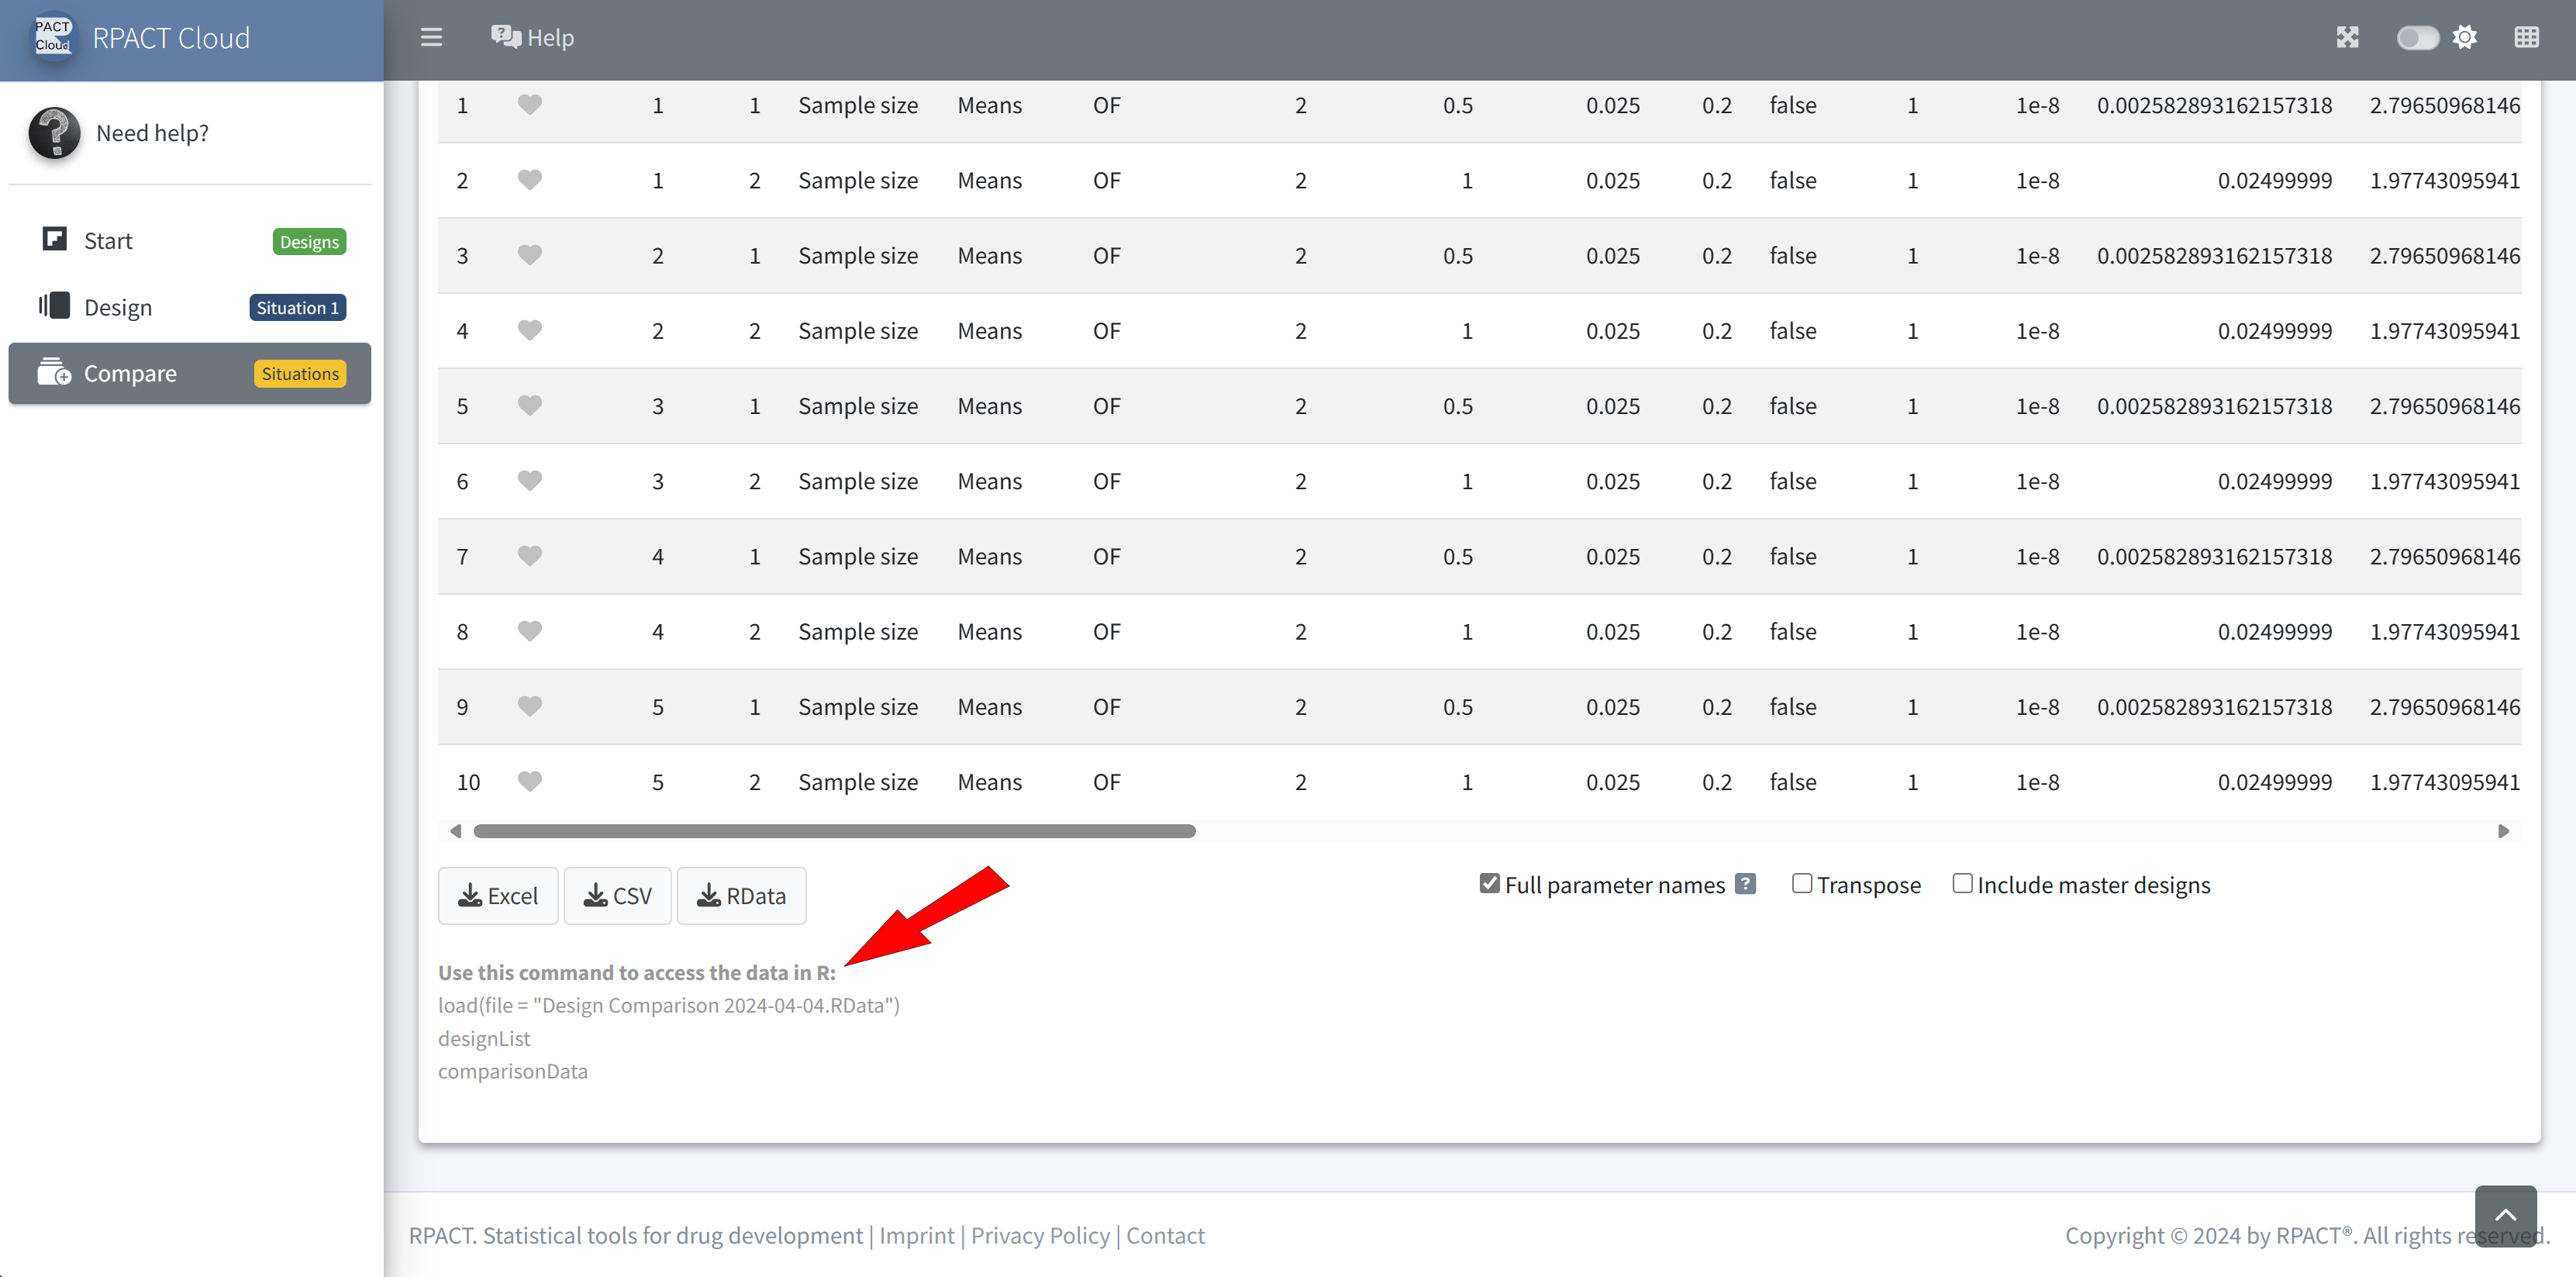
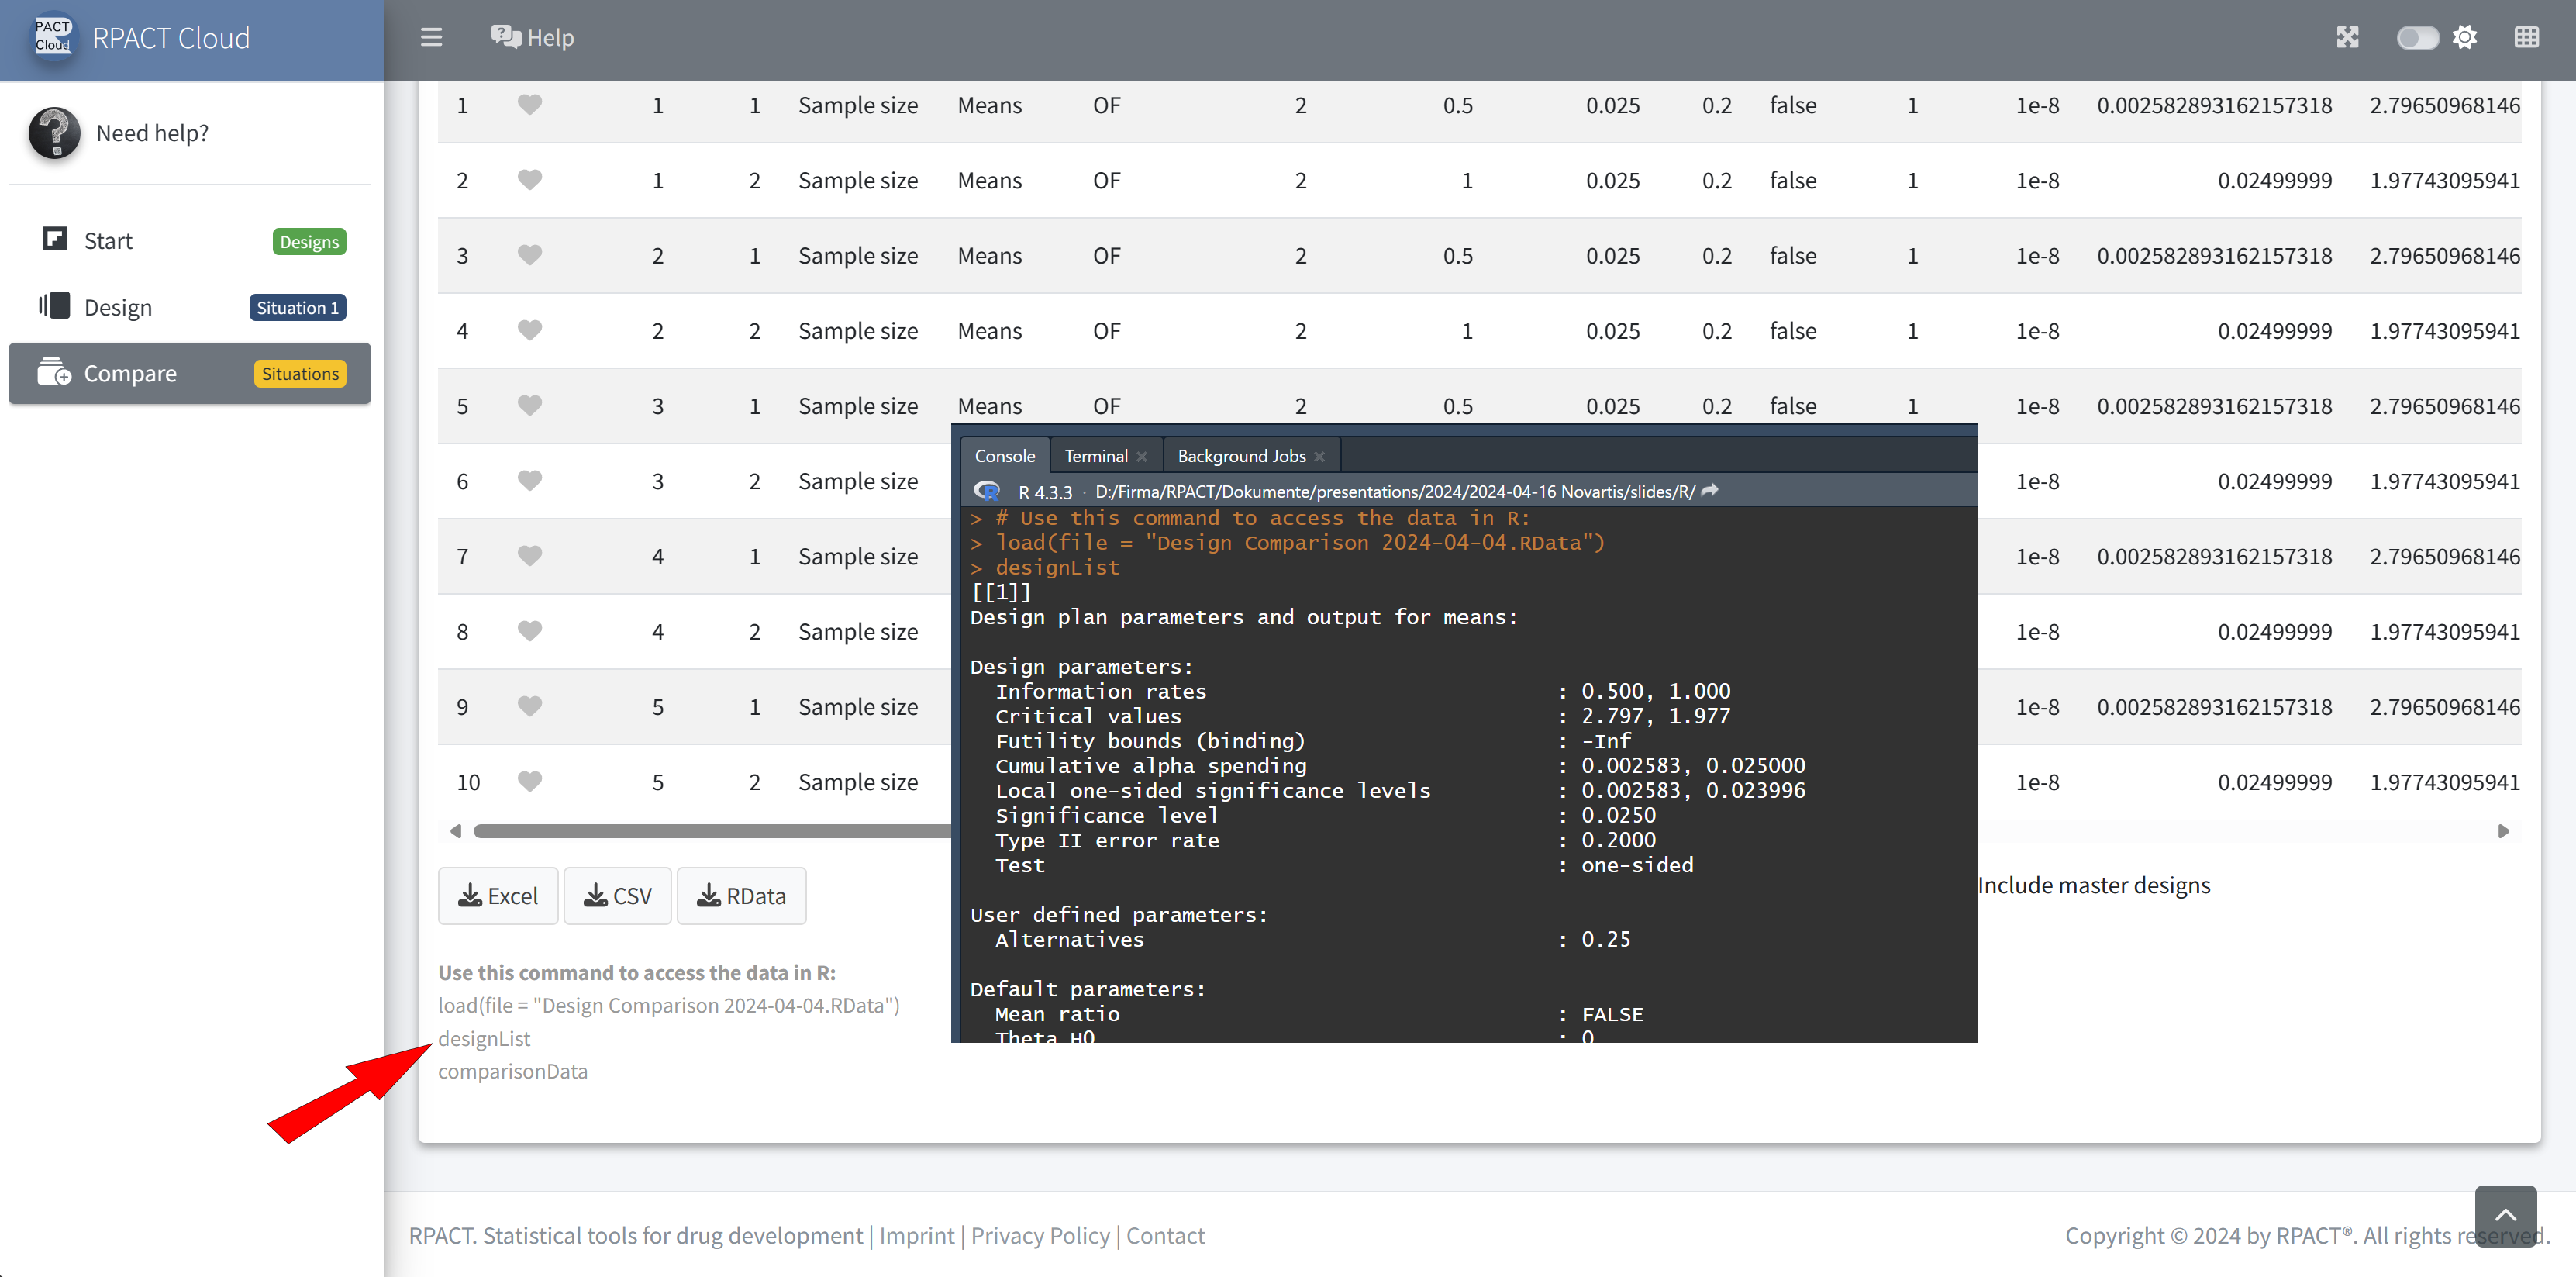
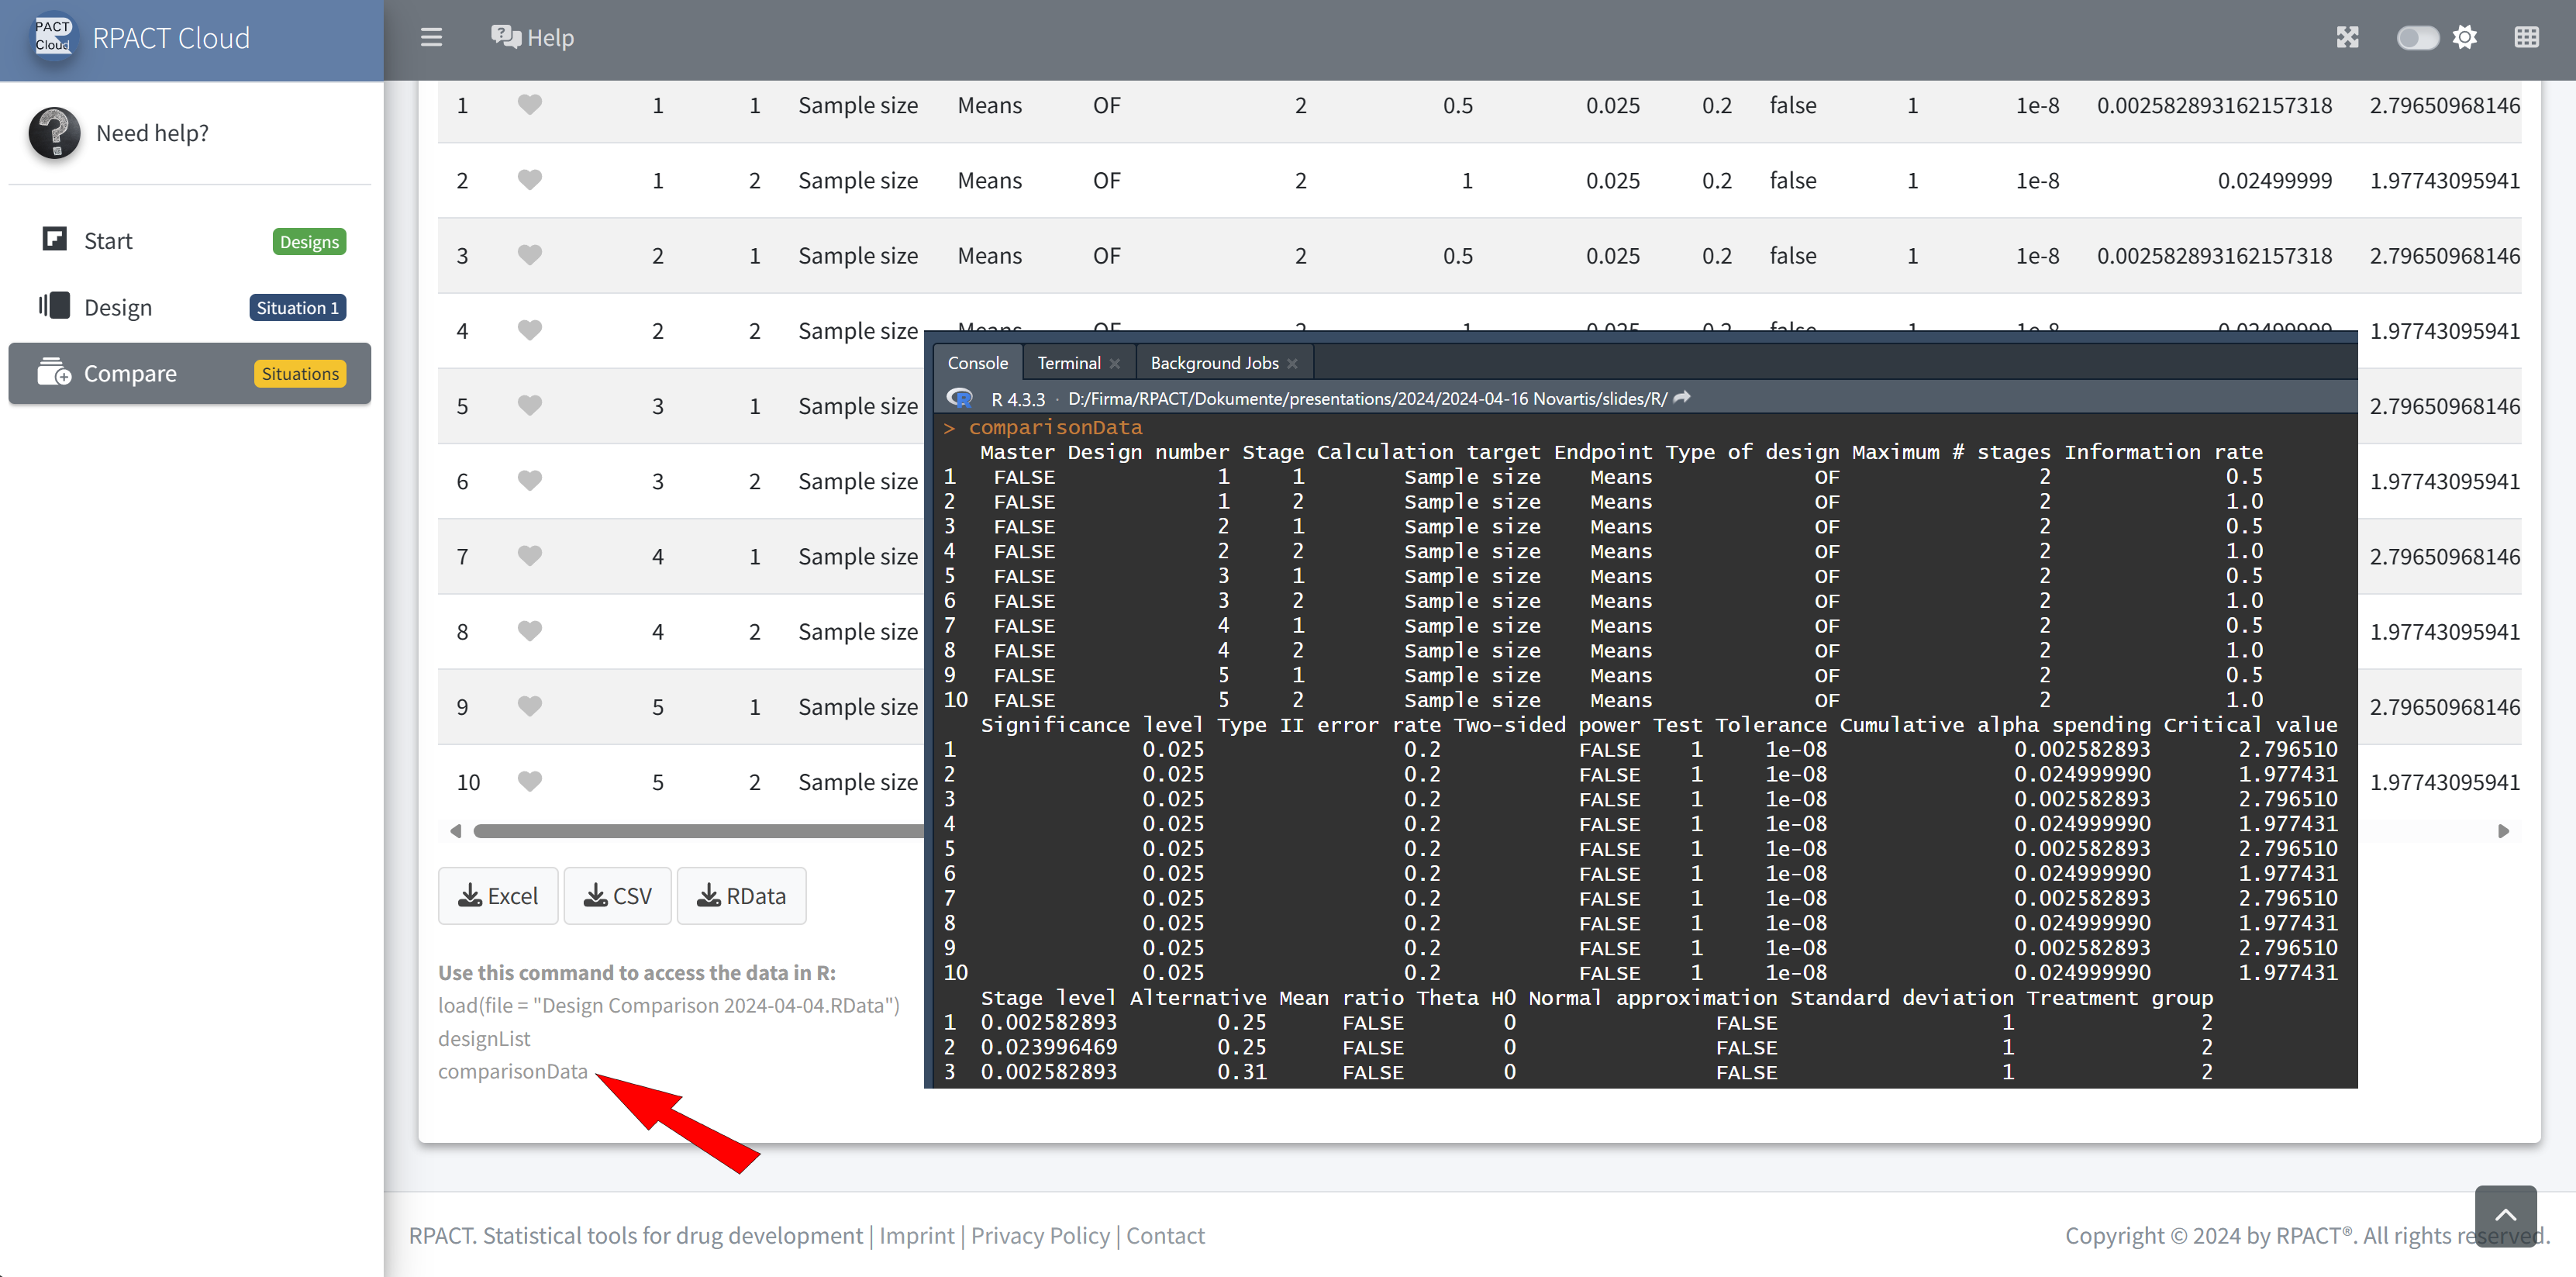
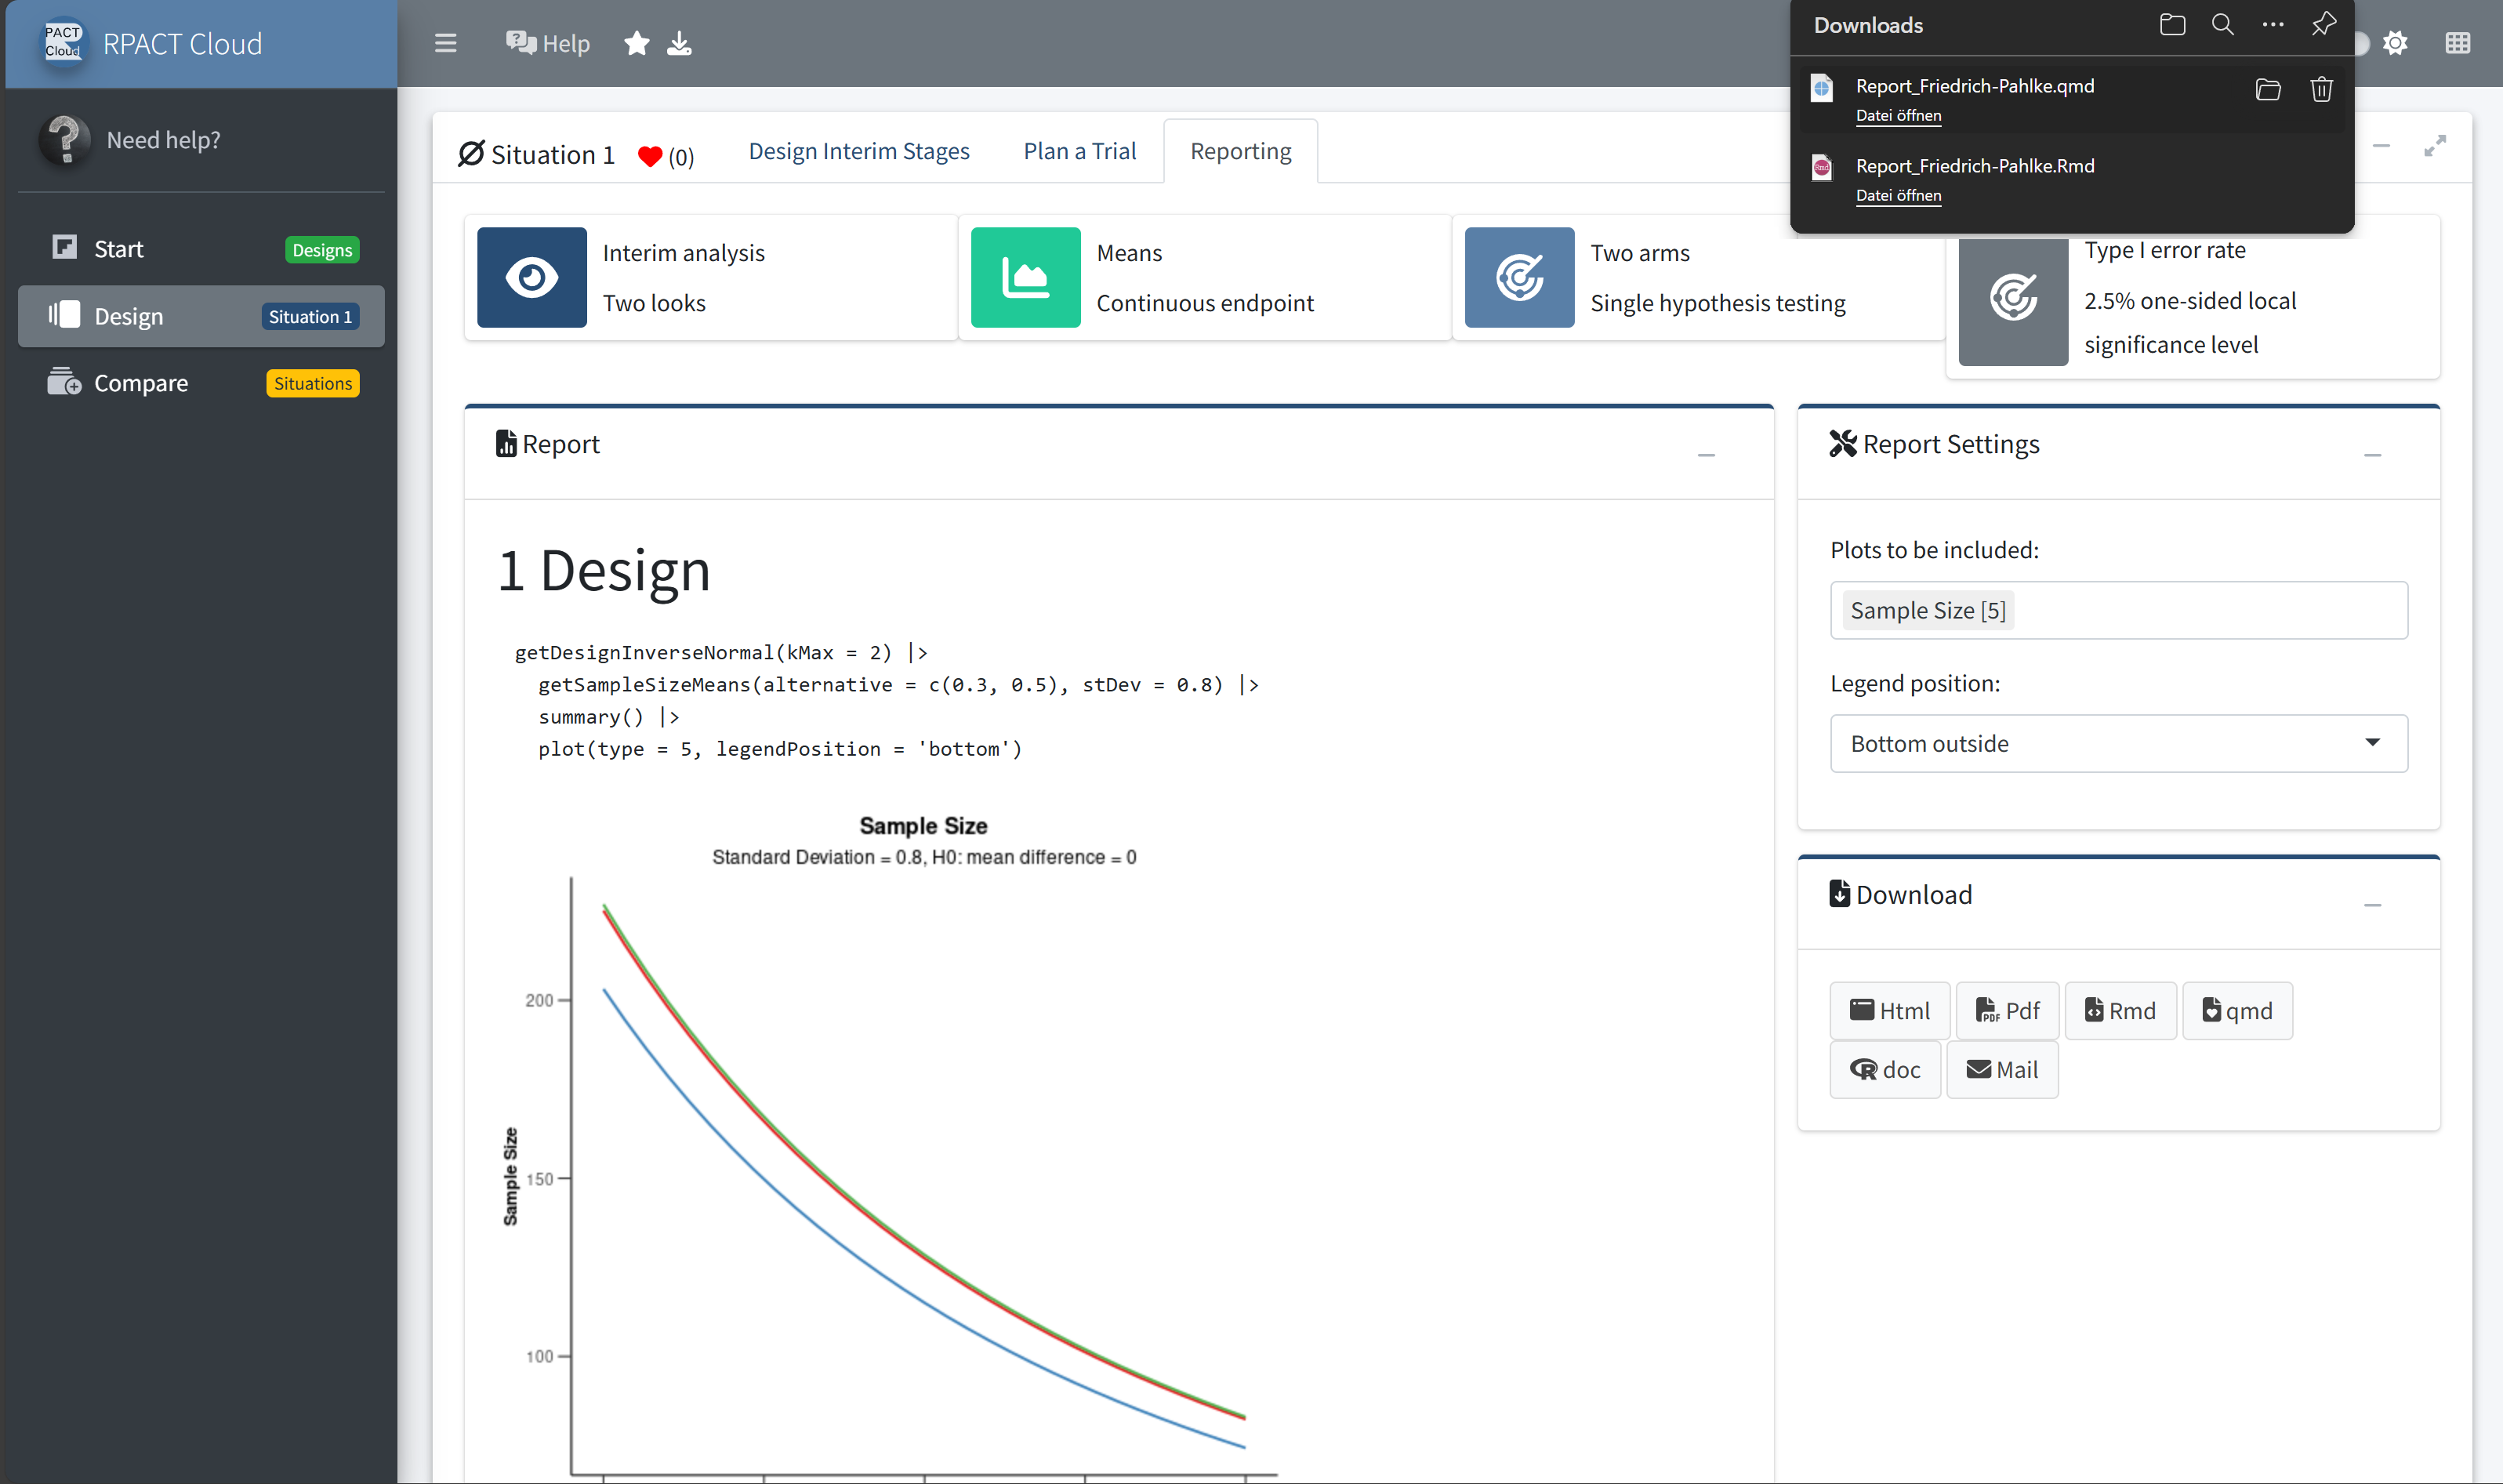
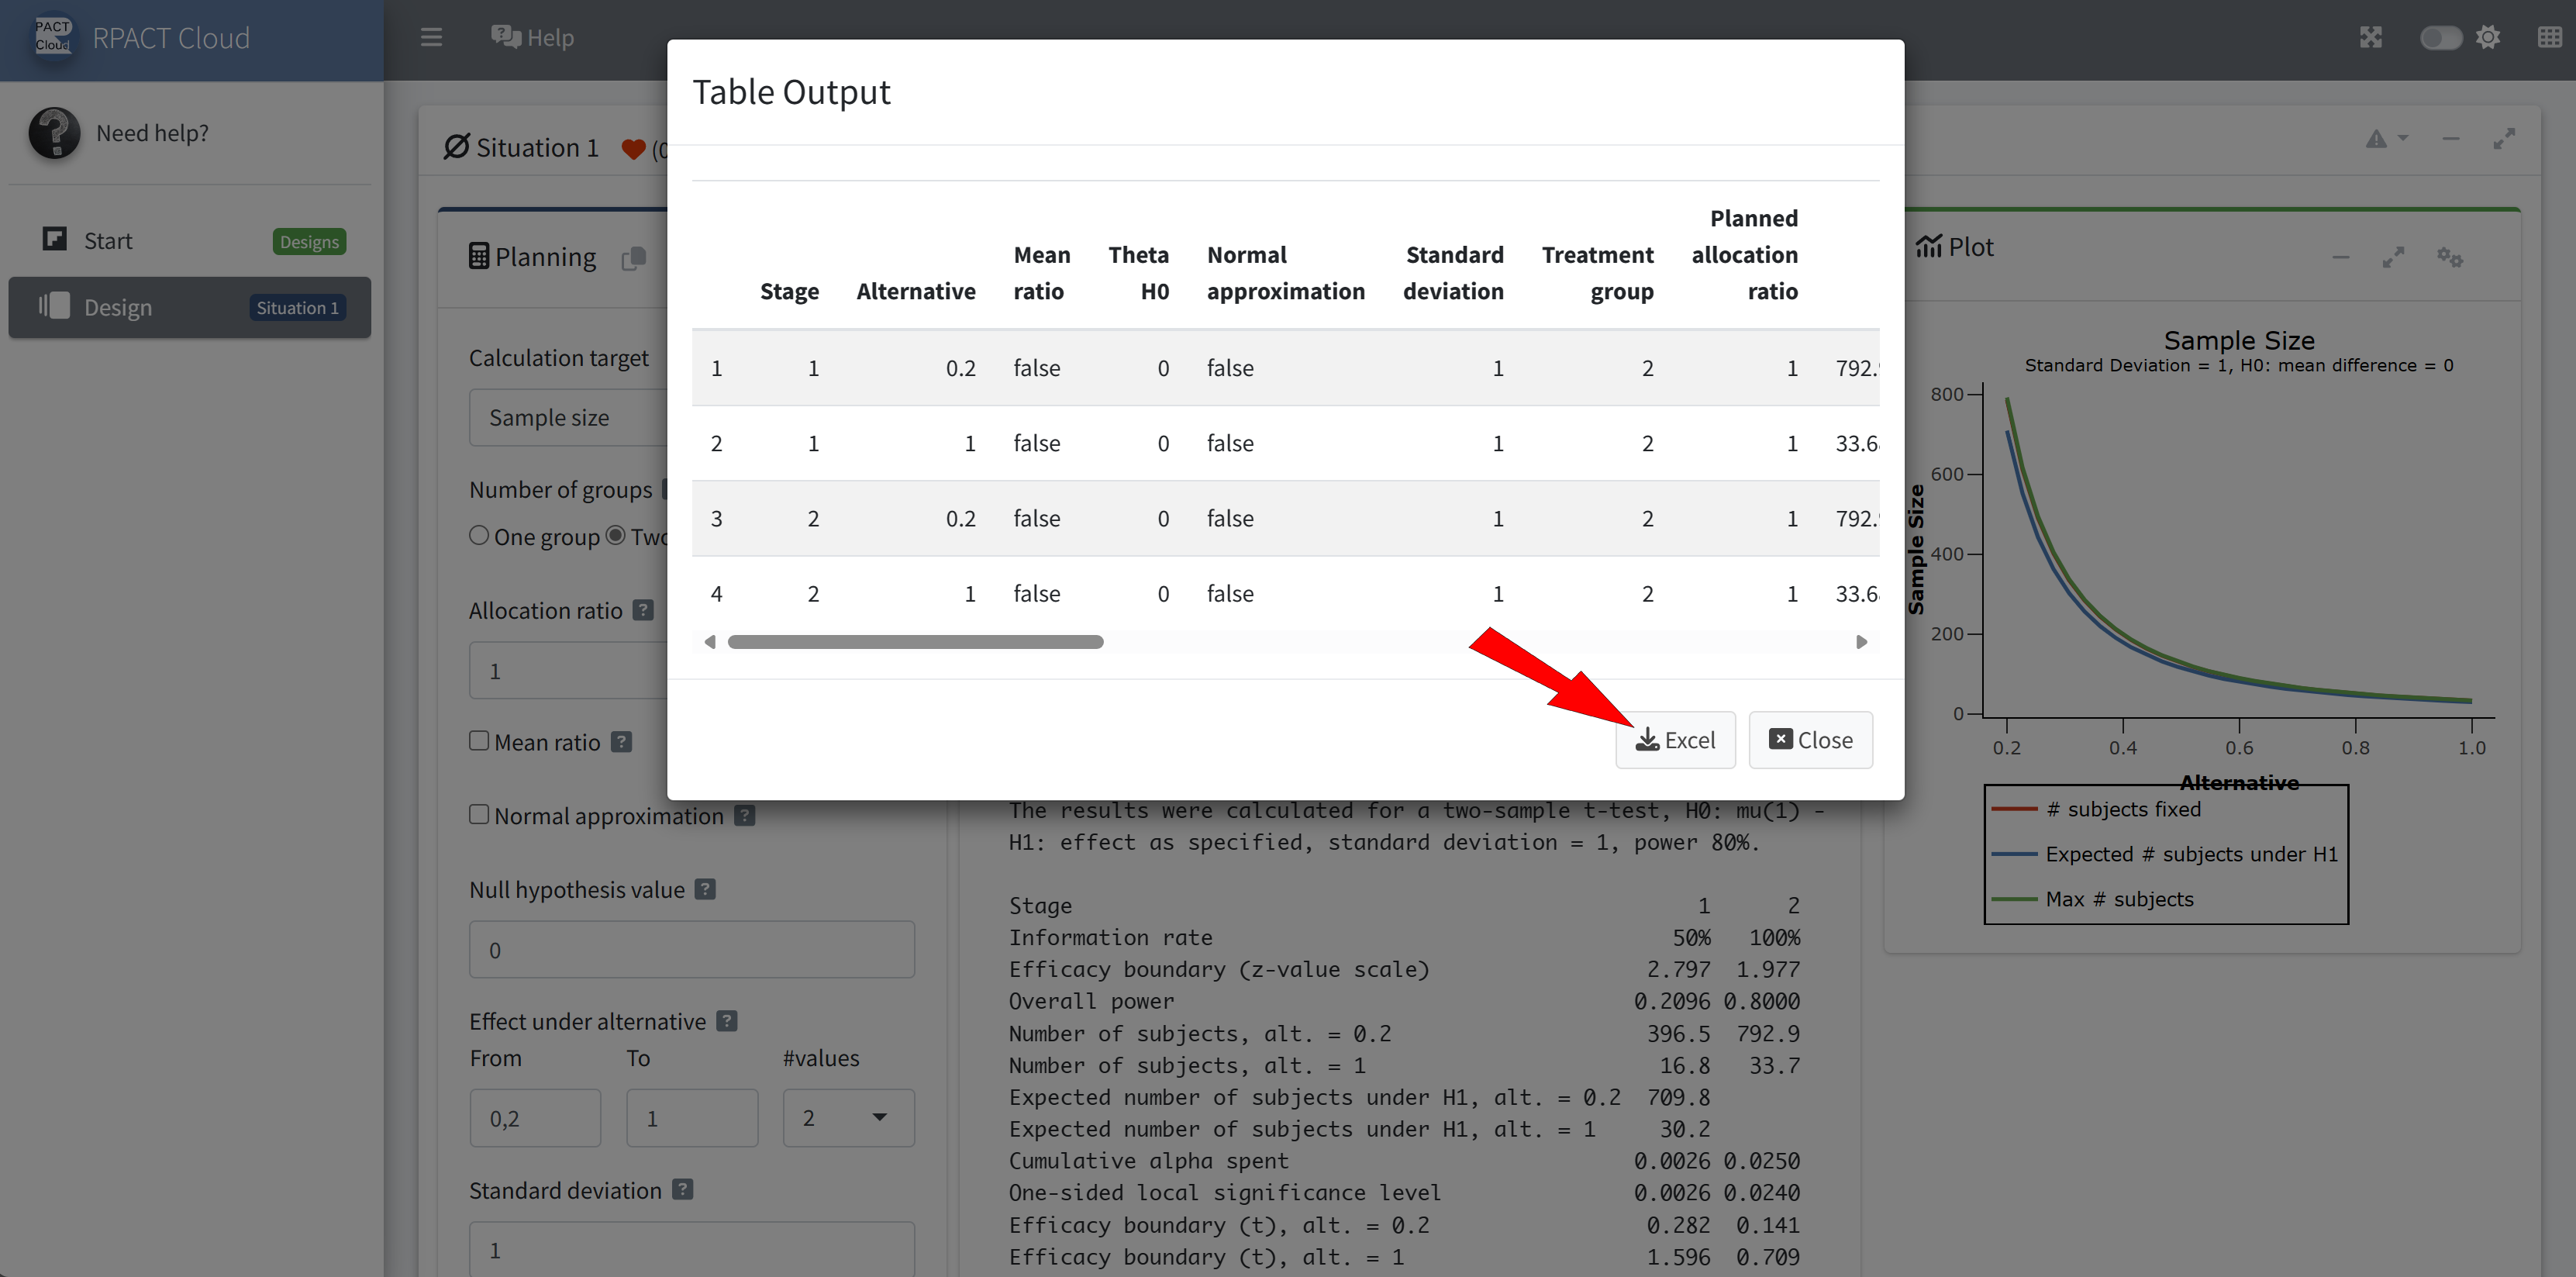
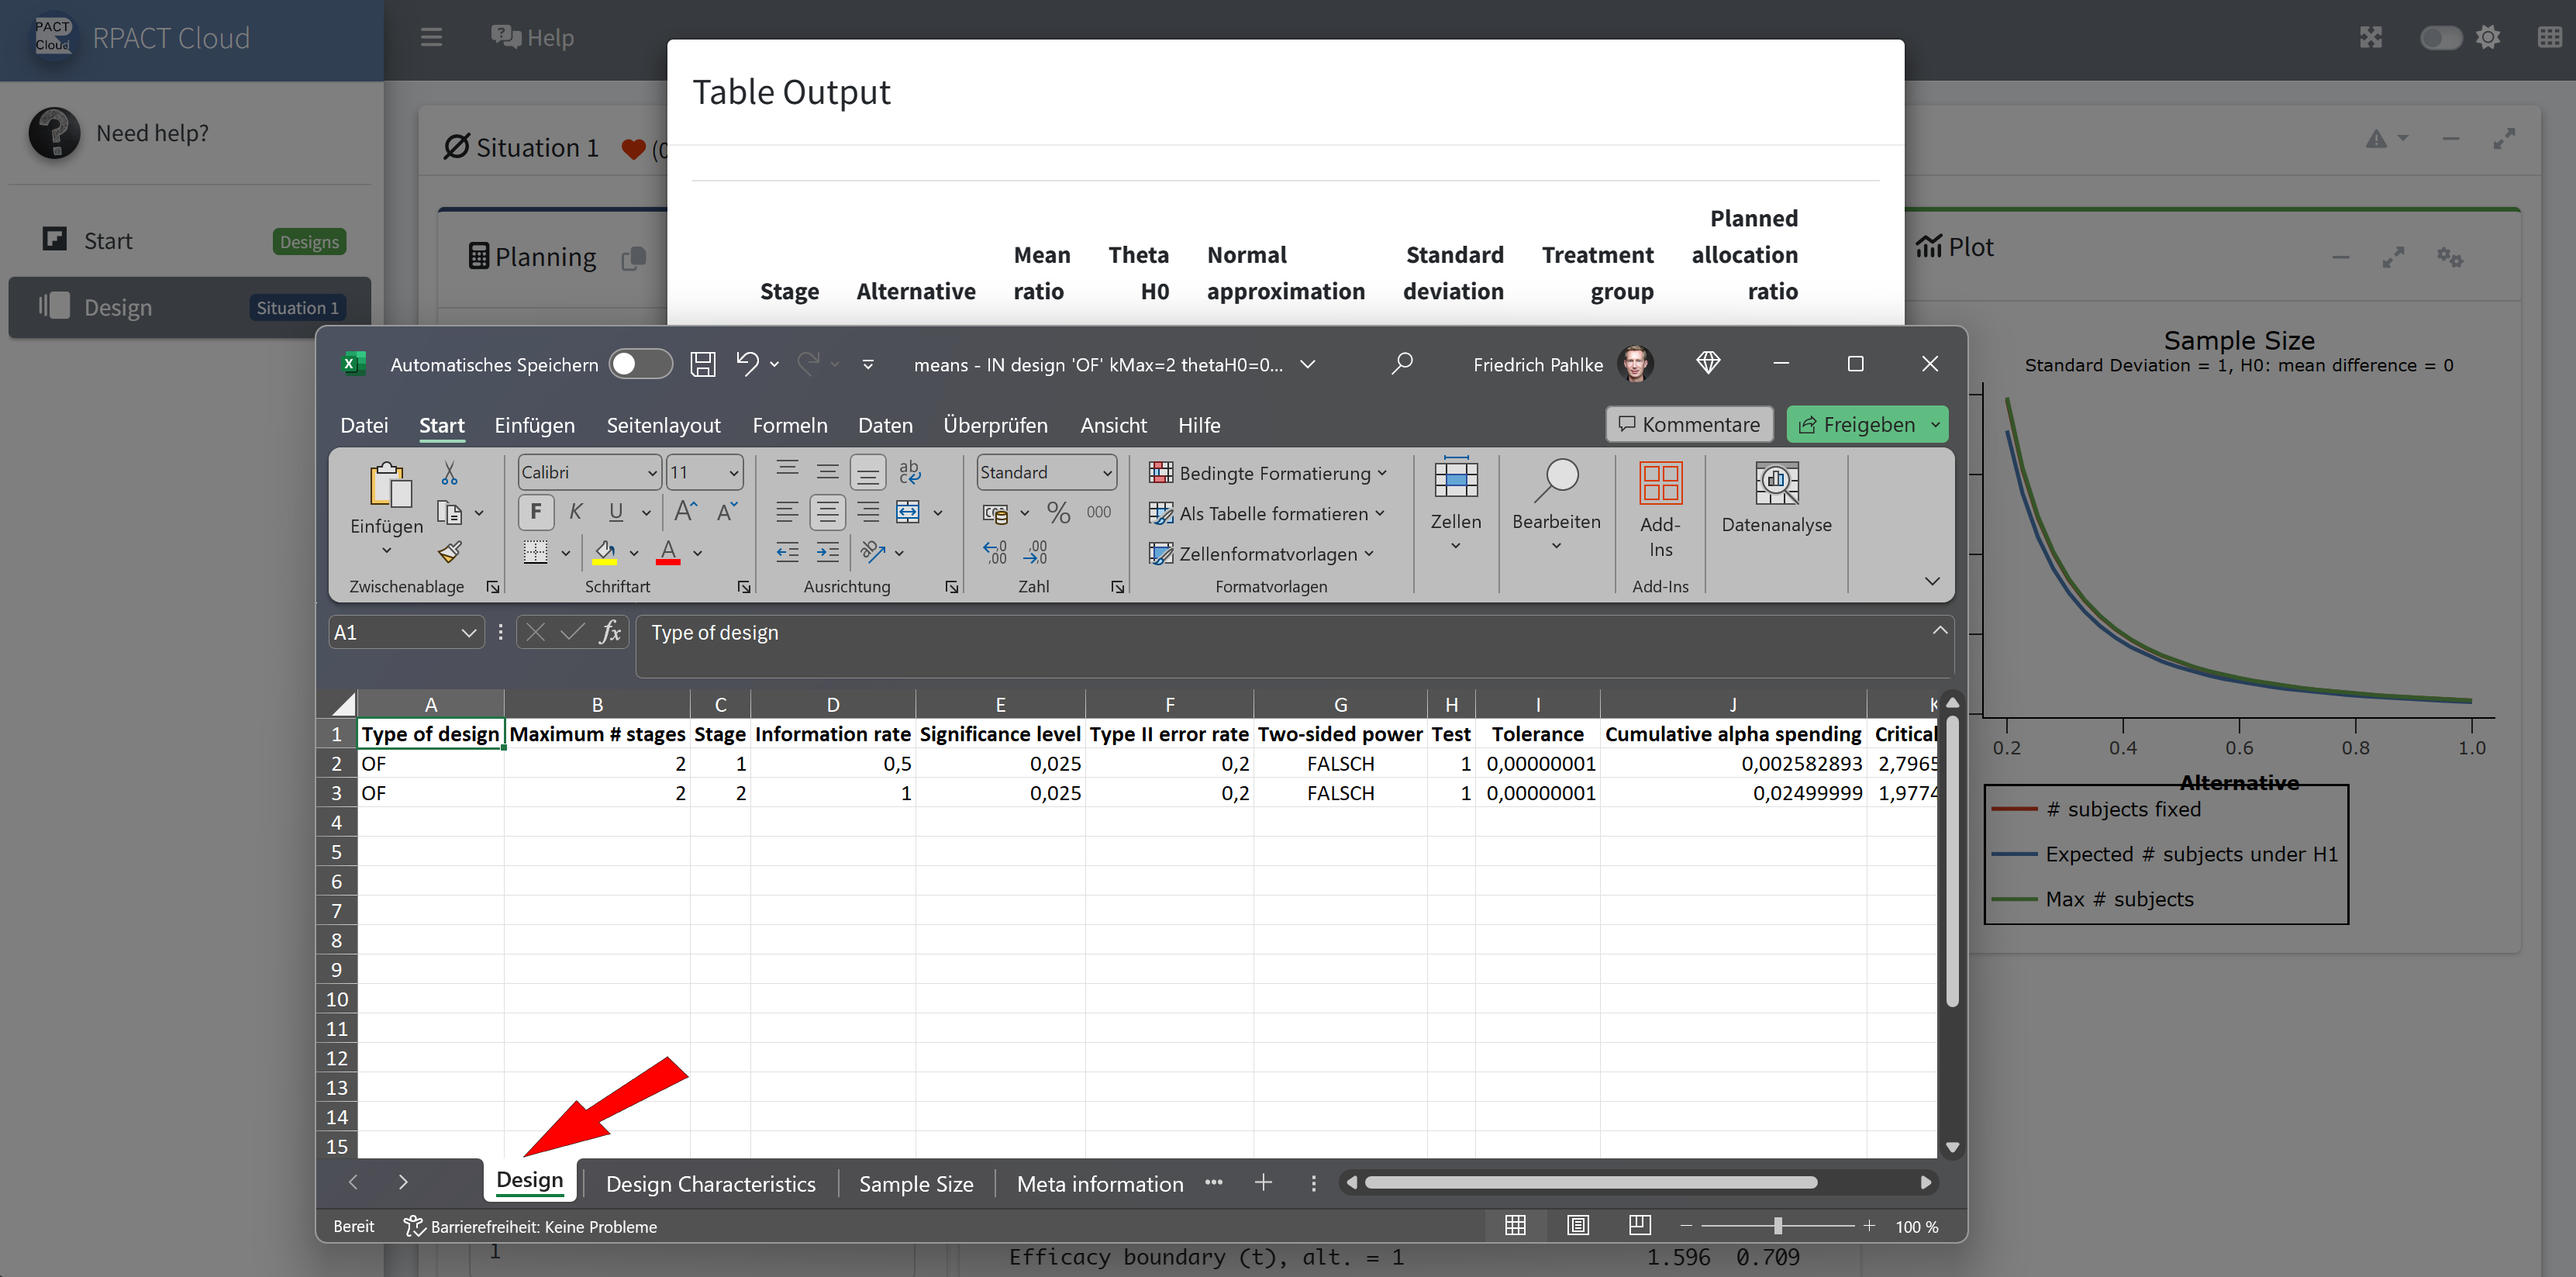
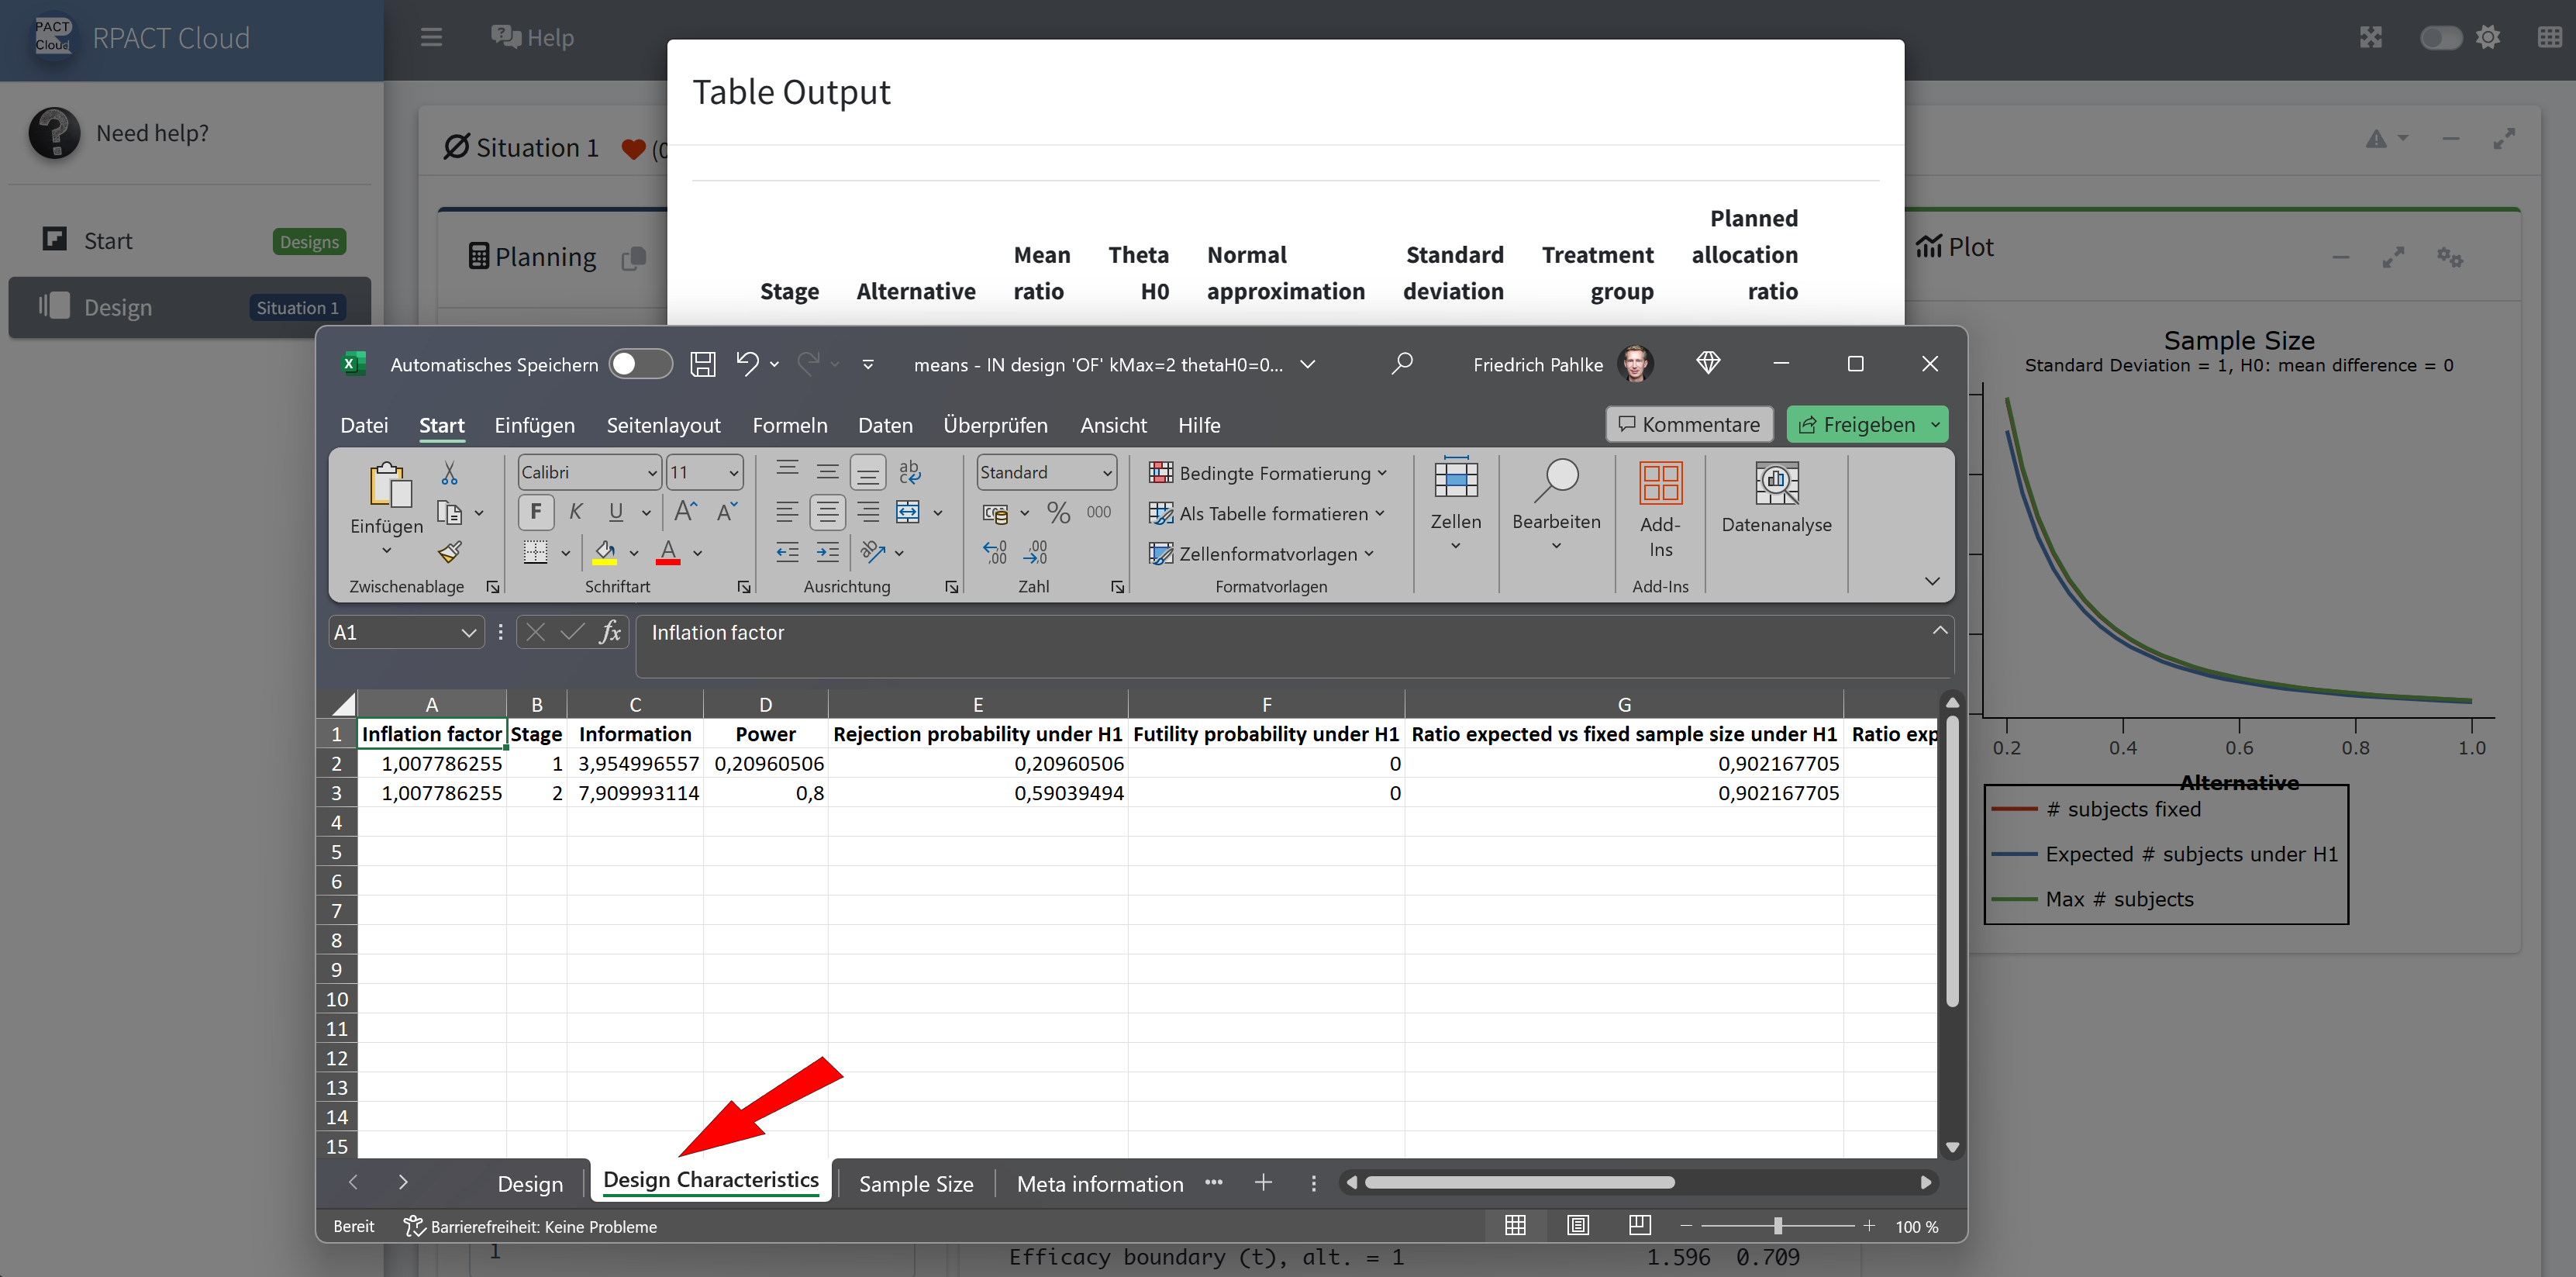
RPACT Cloud – Export
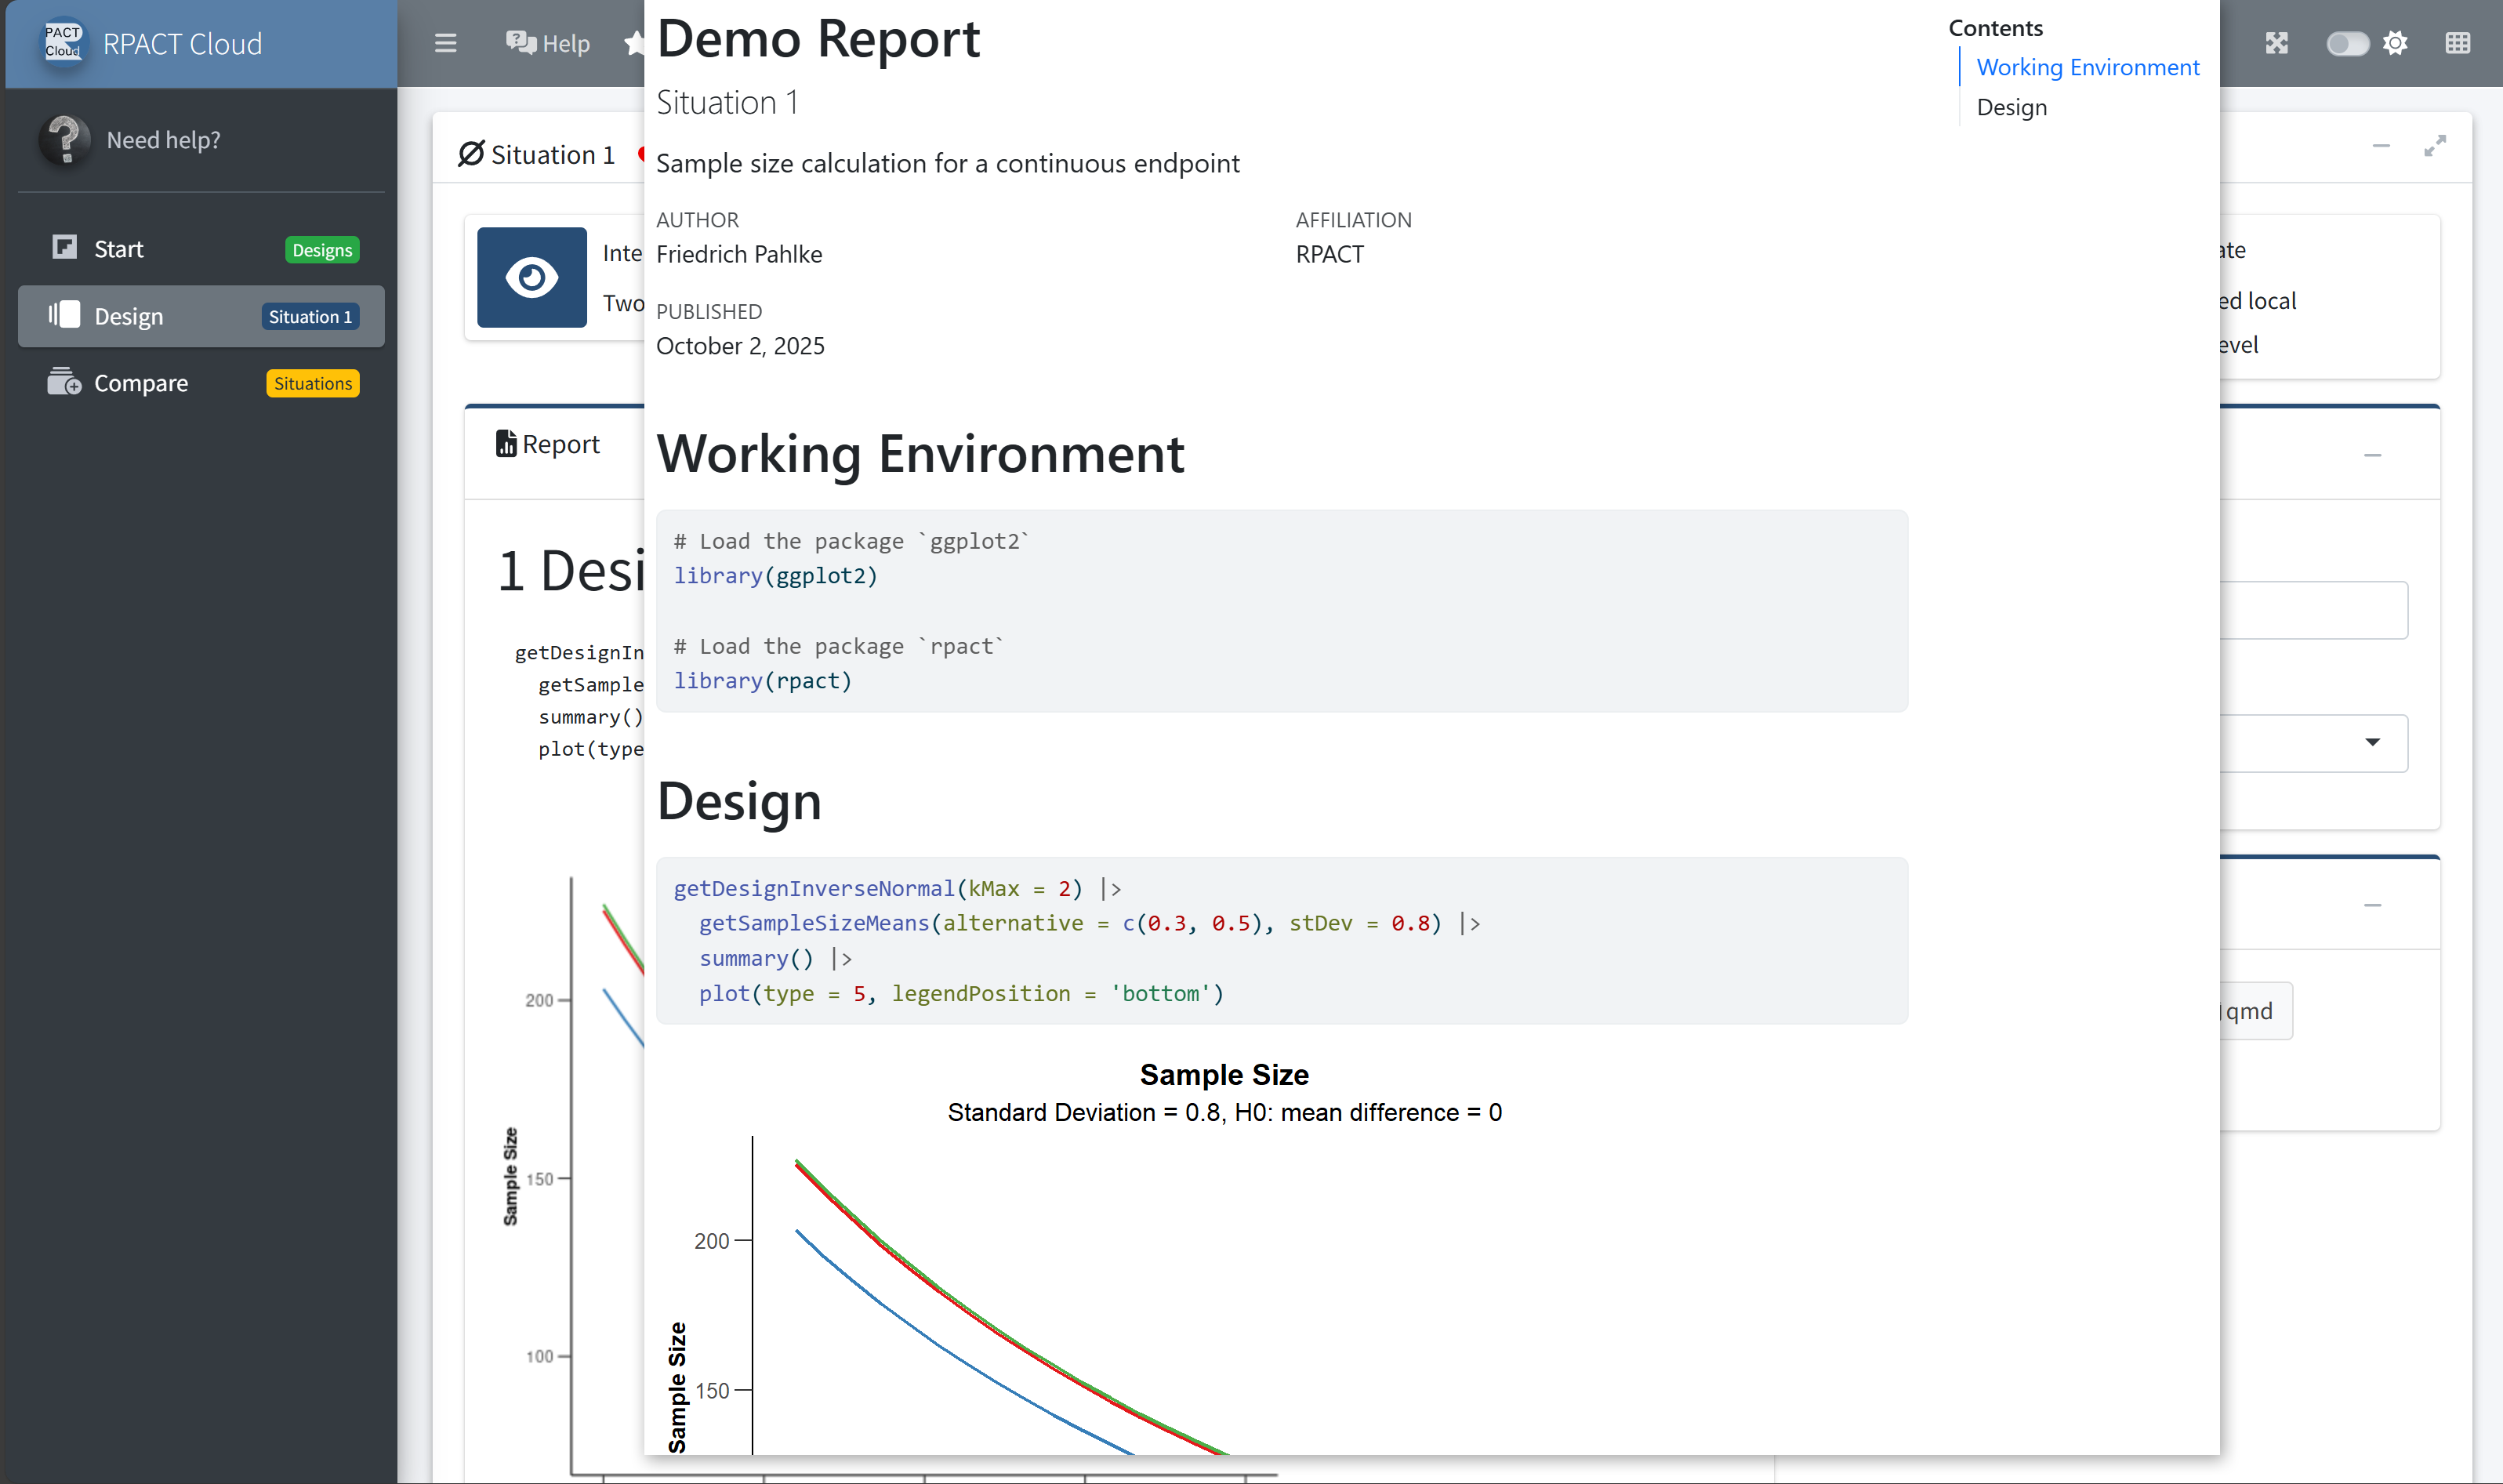
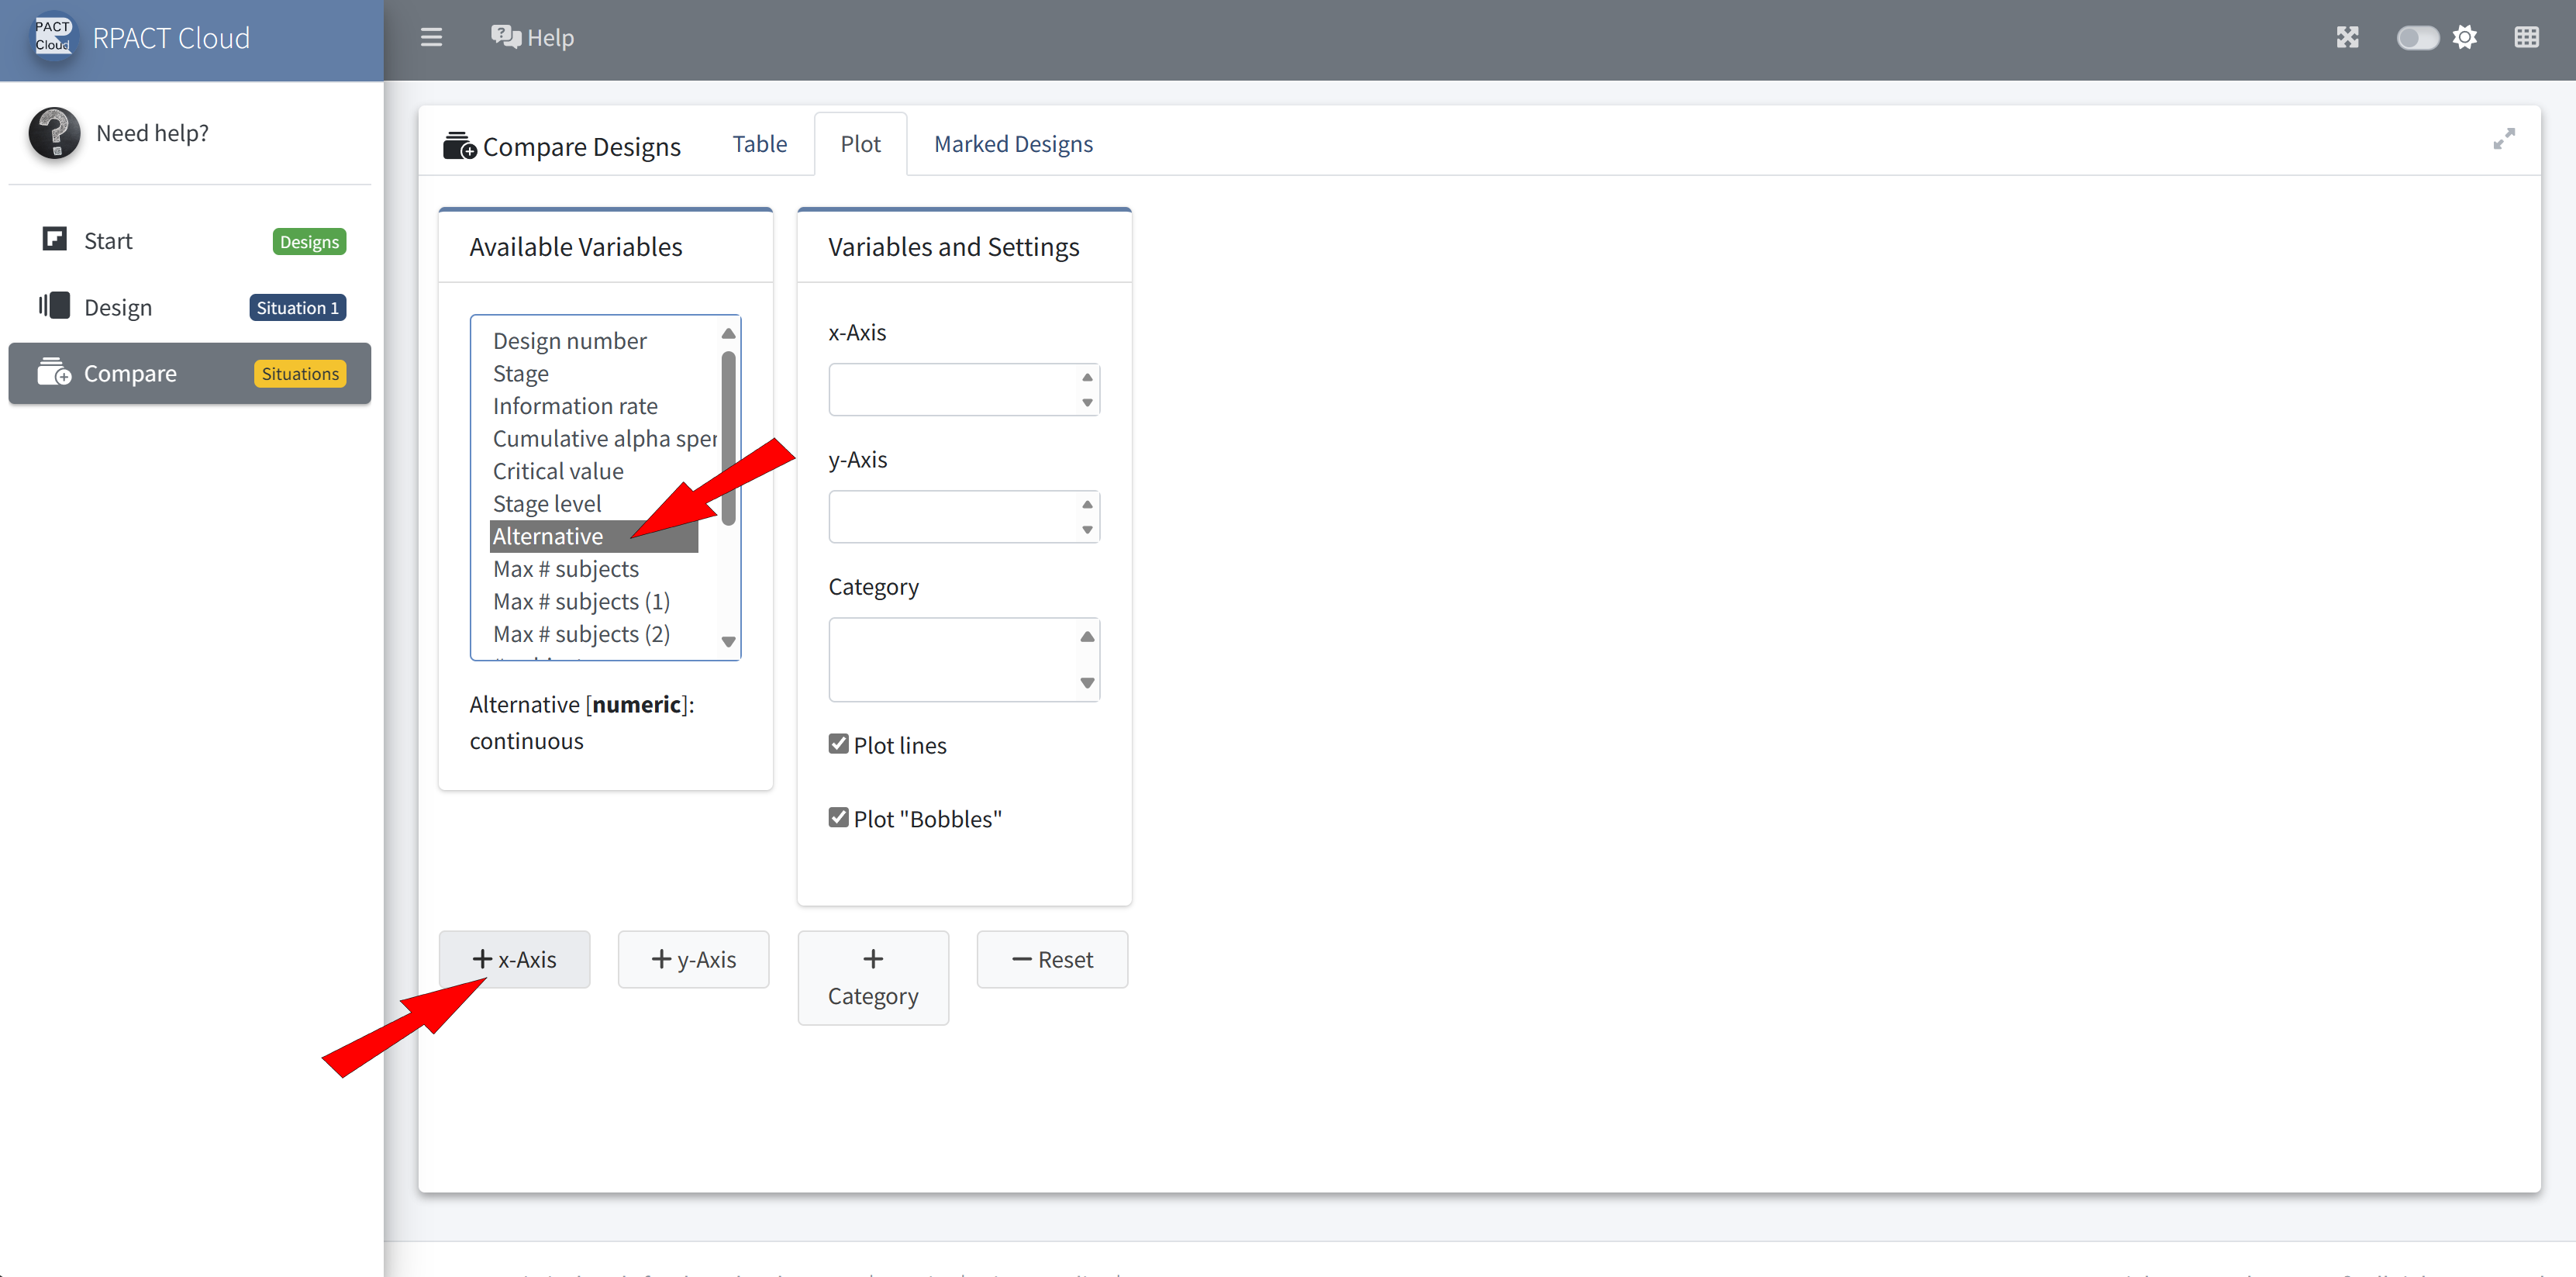
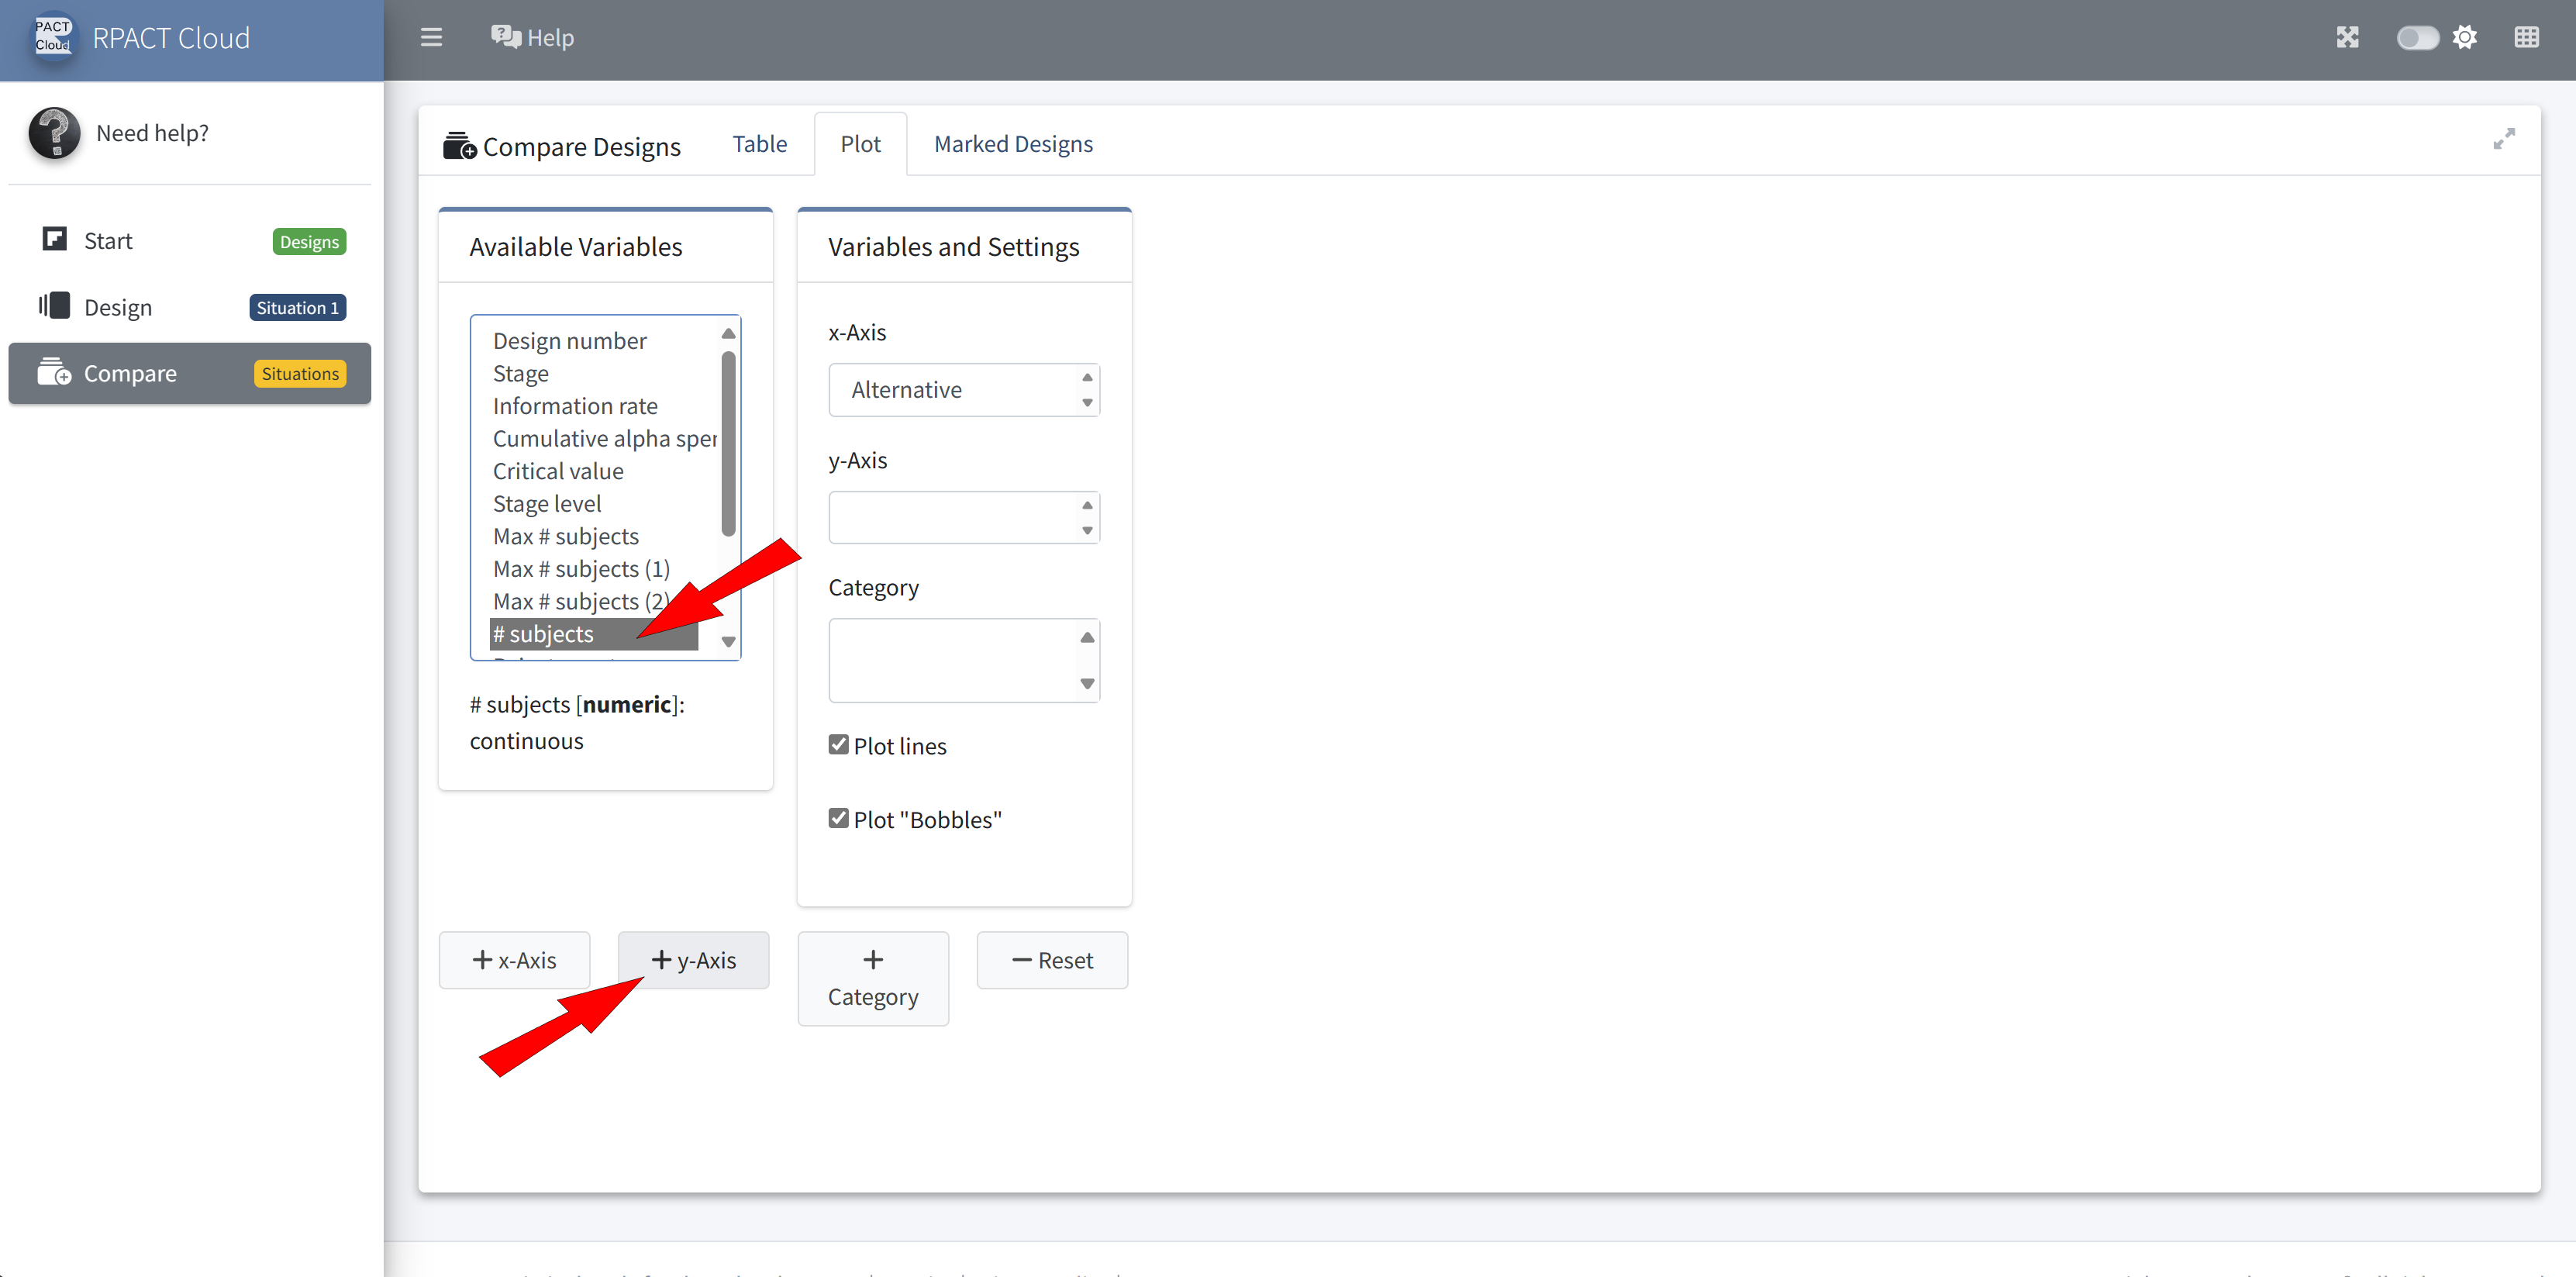
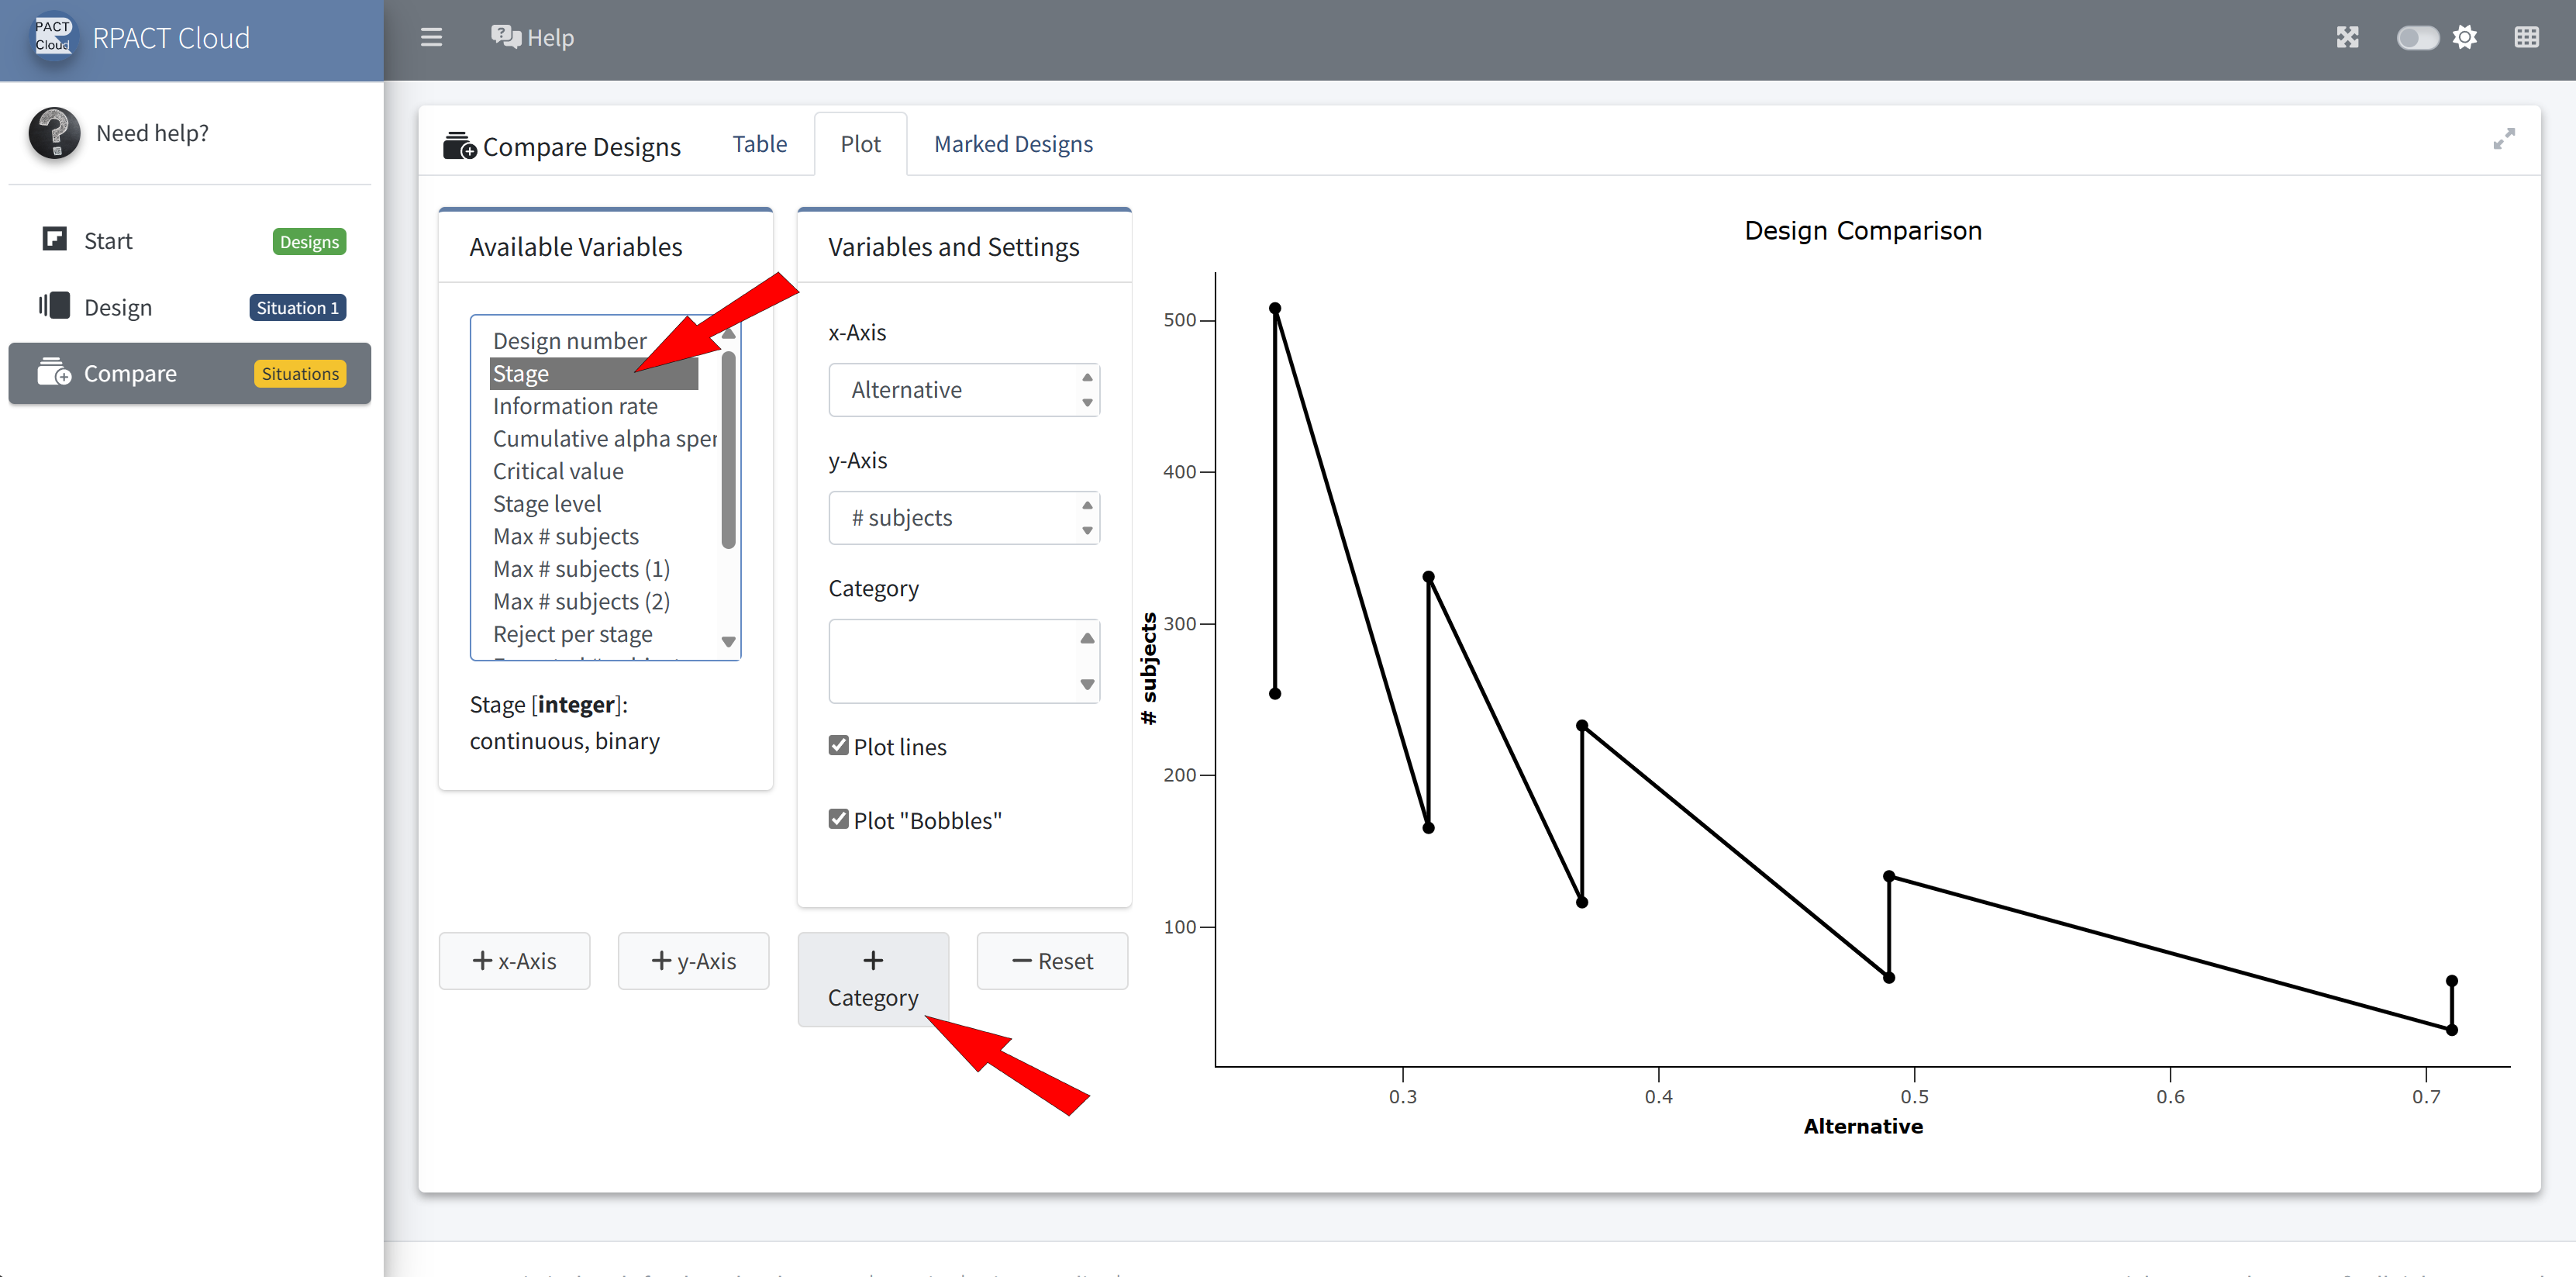
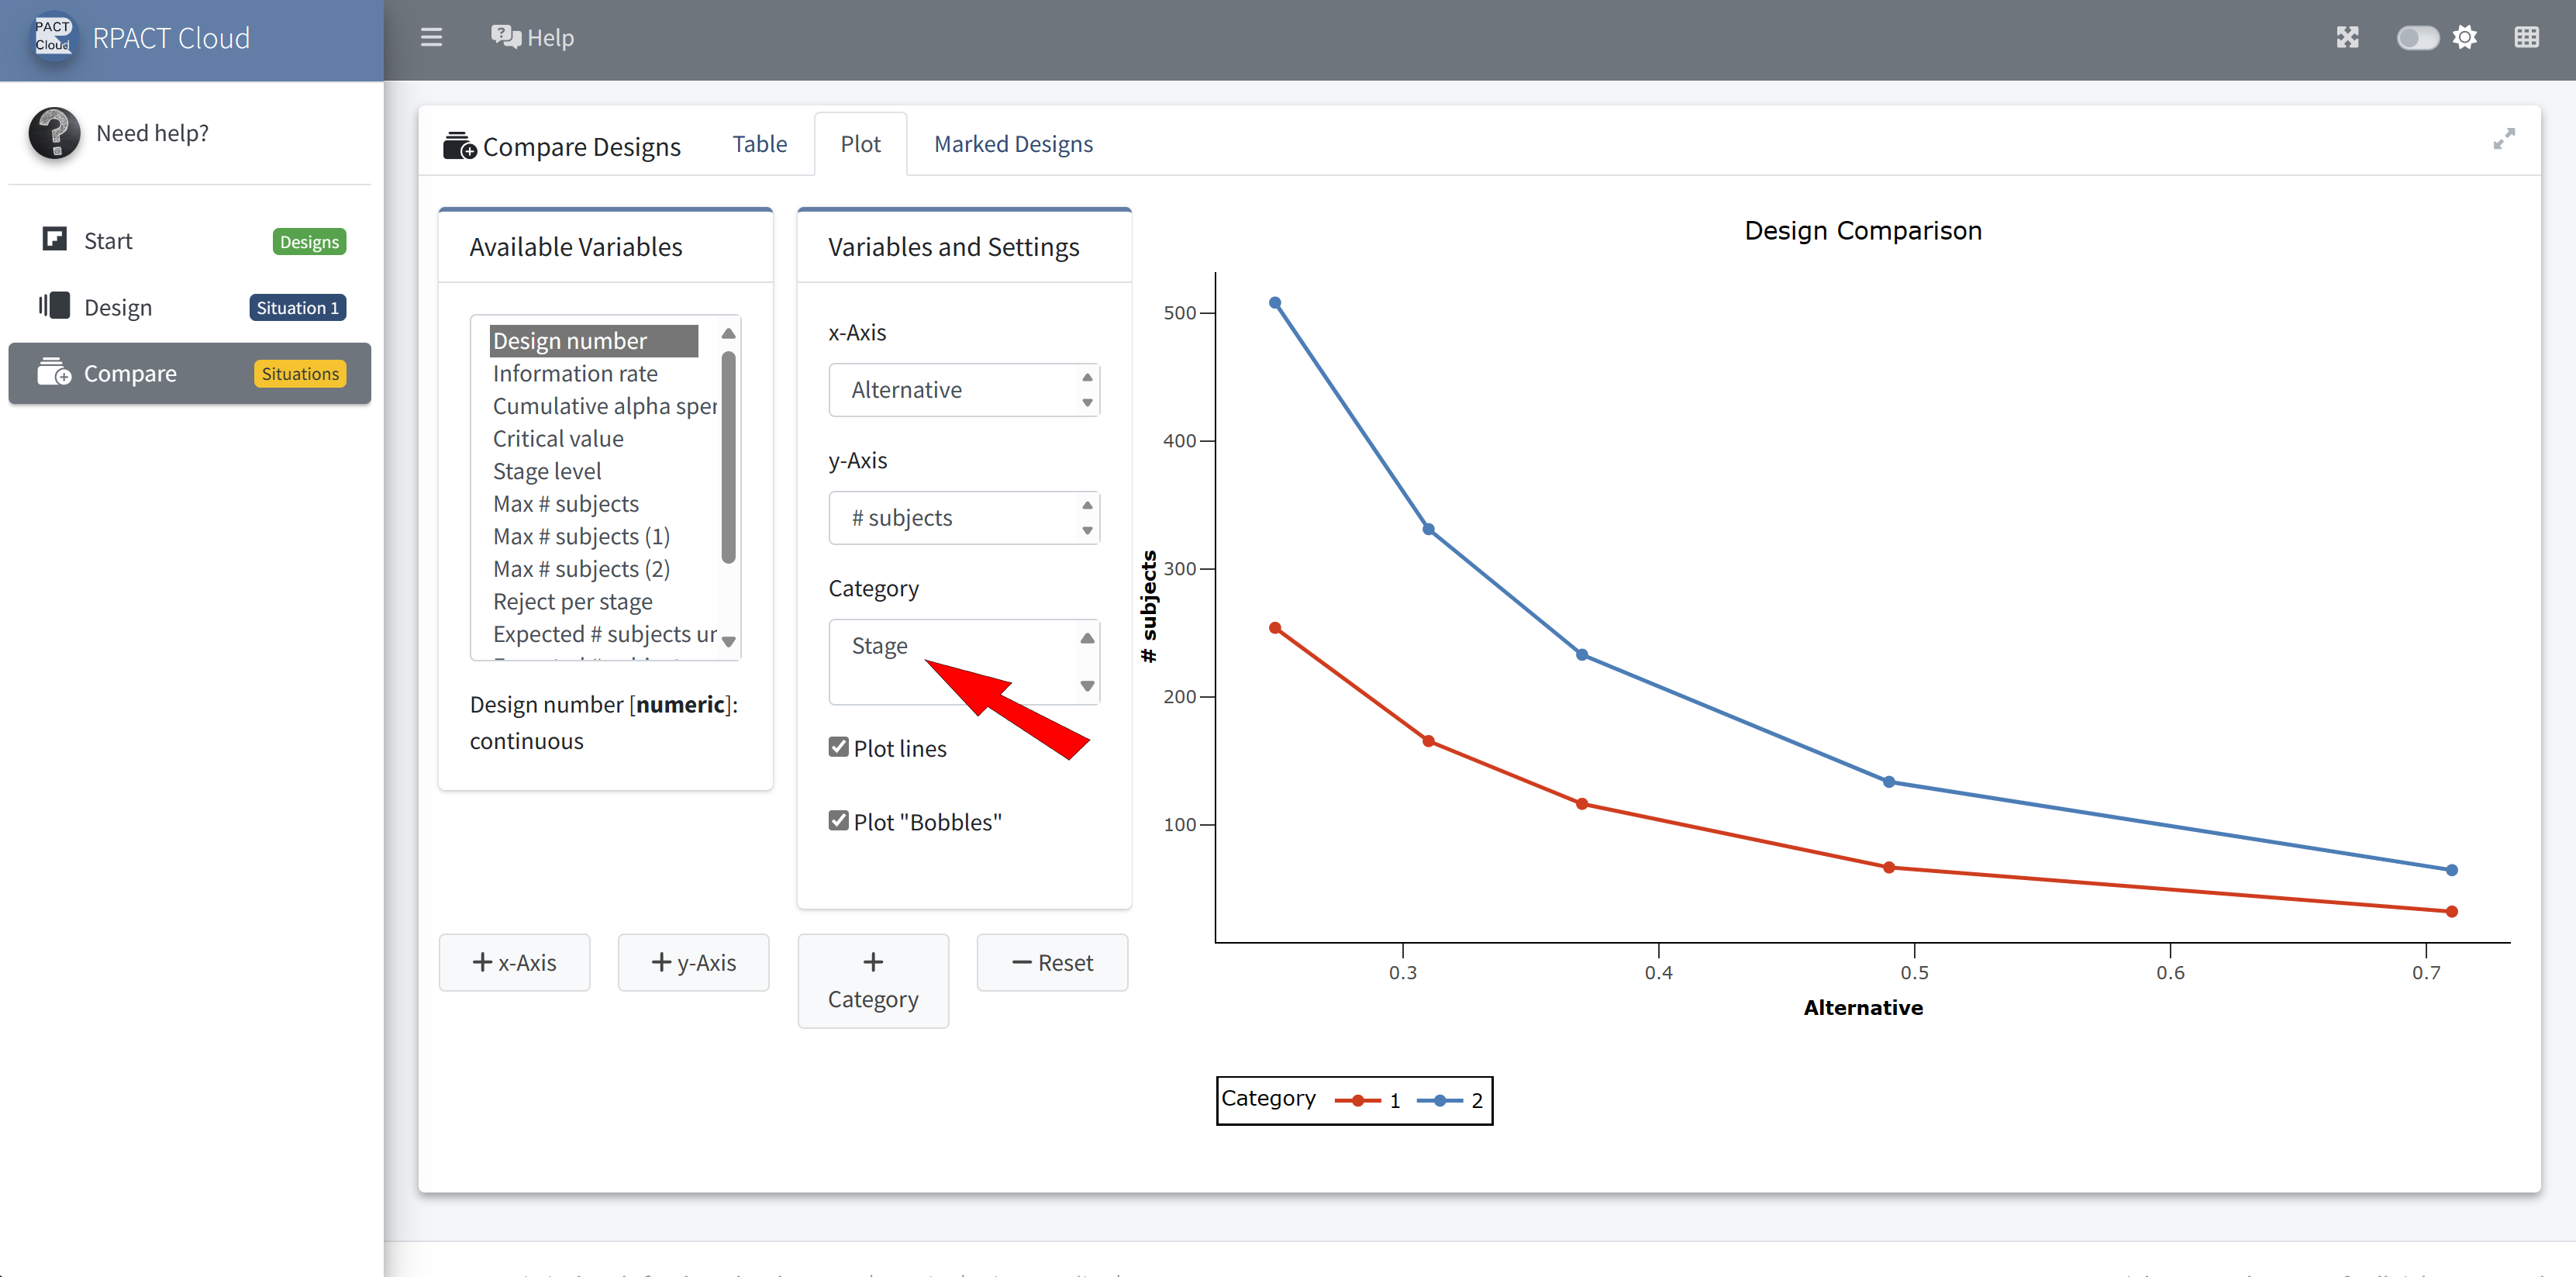
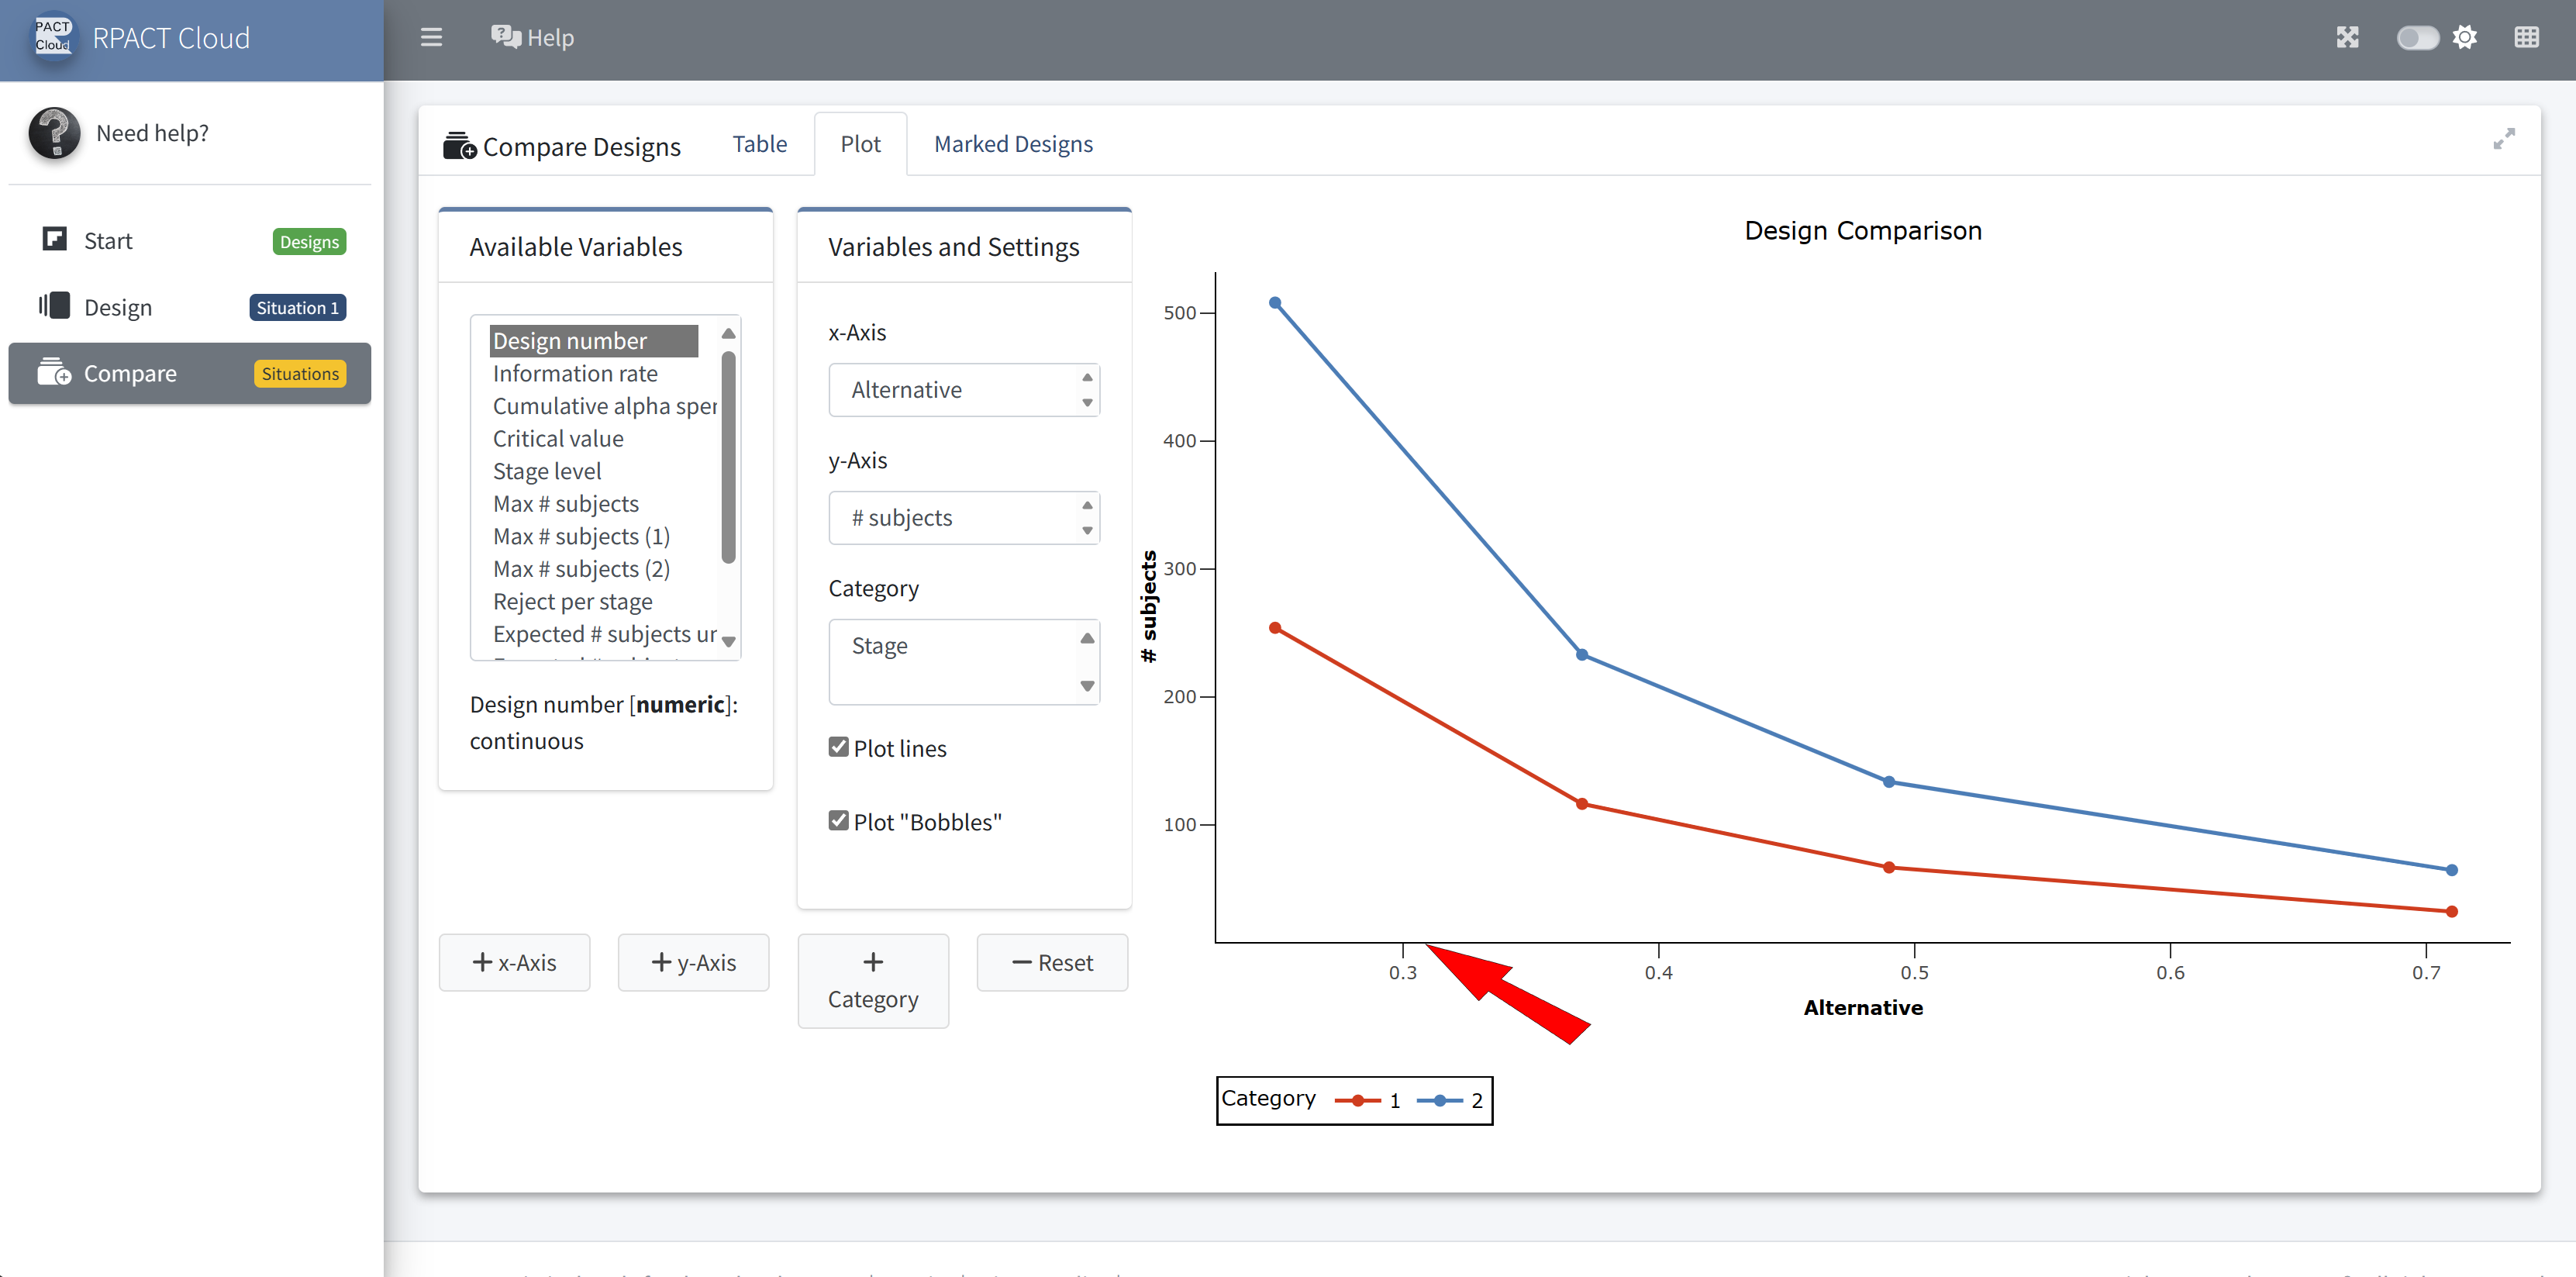
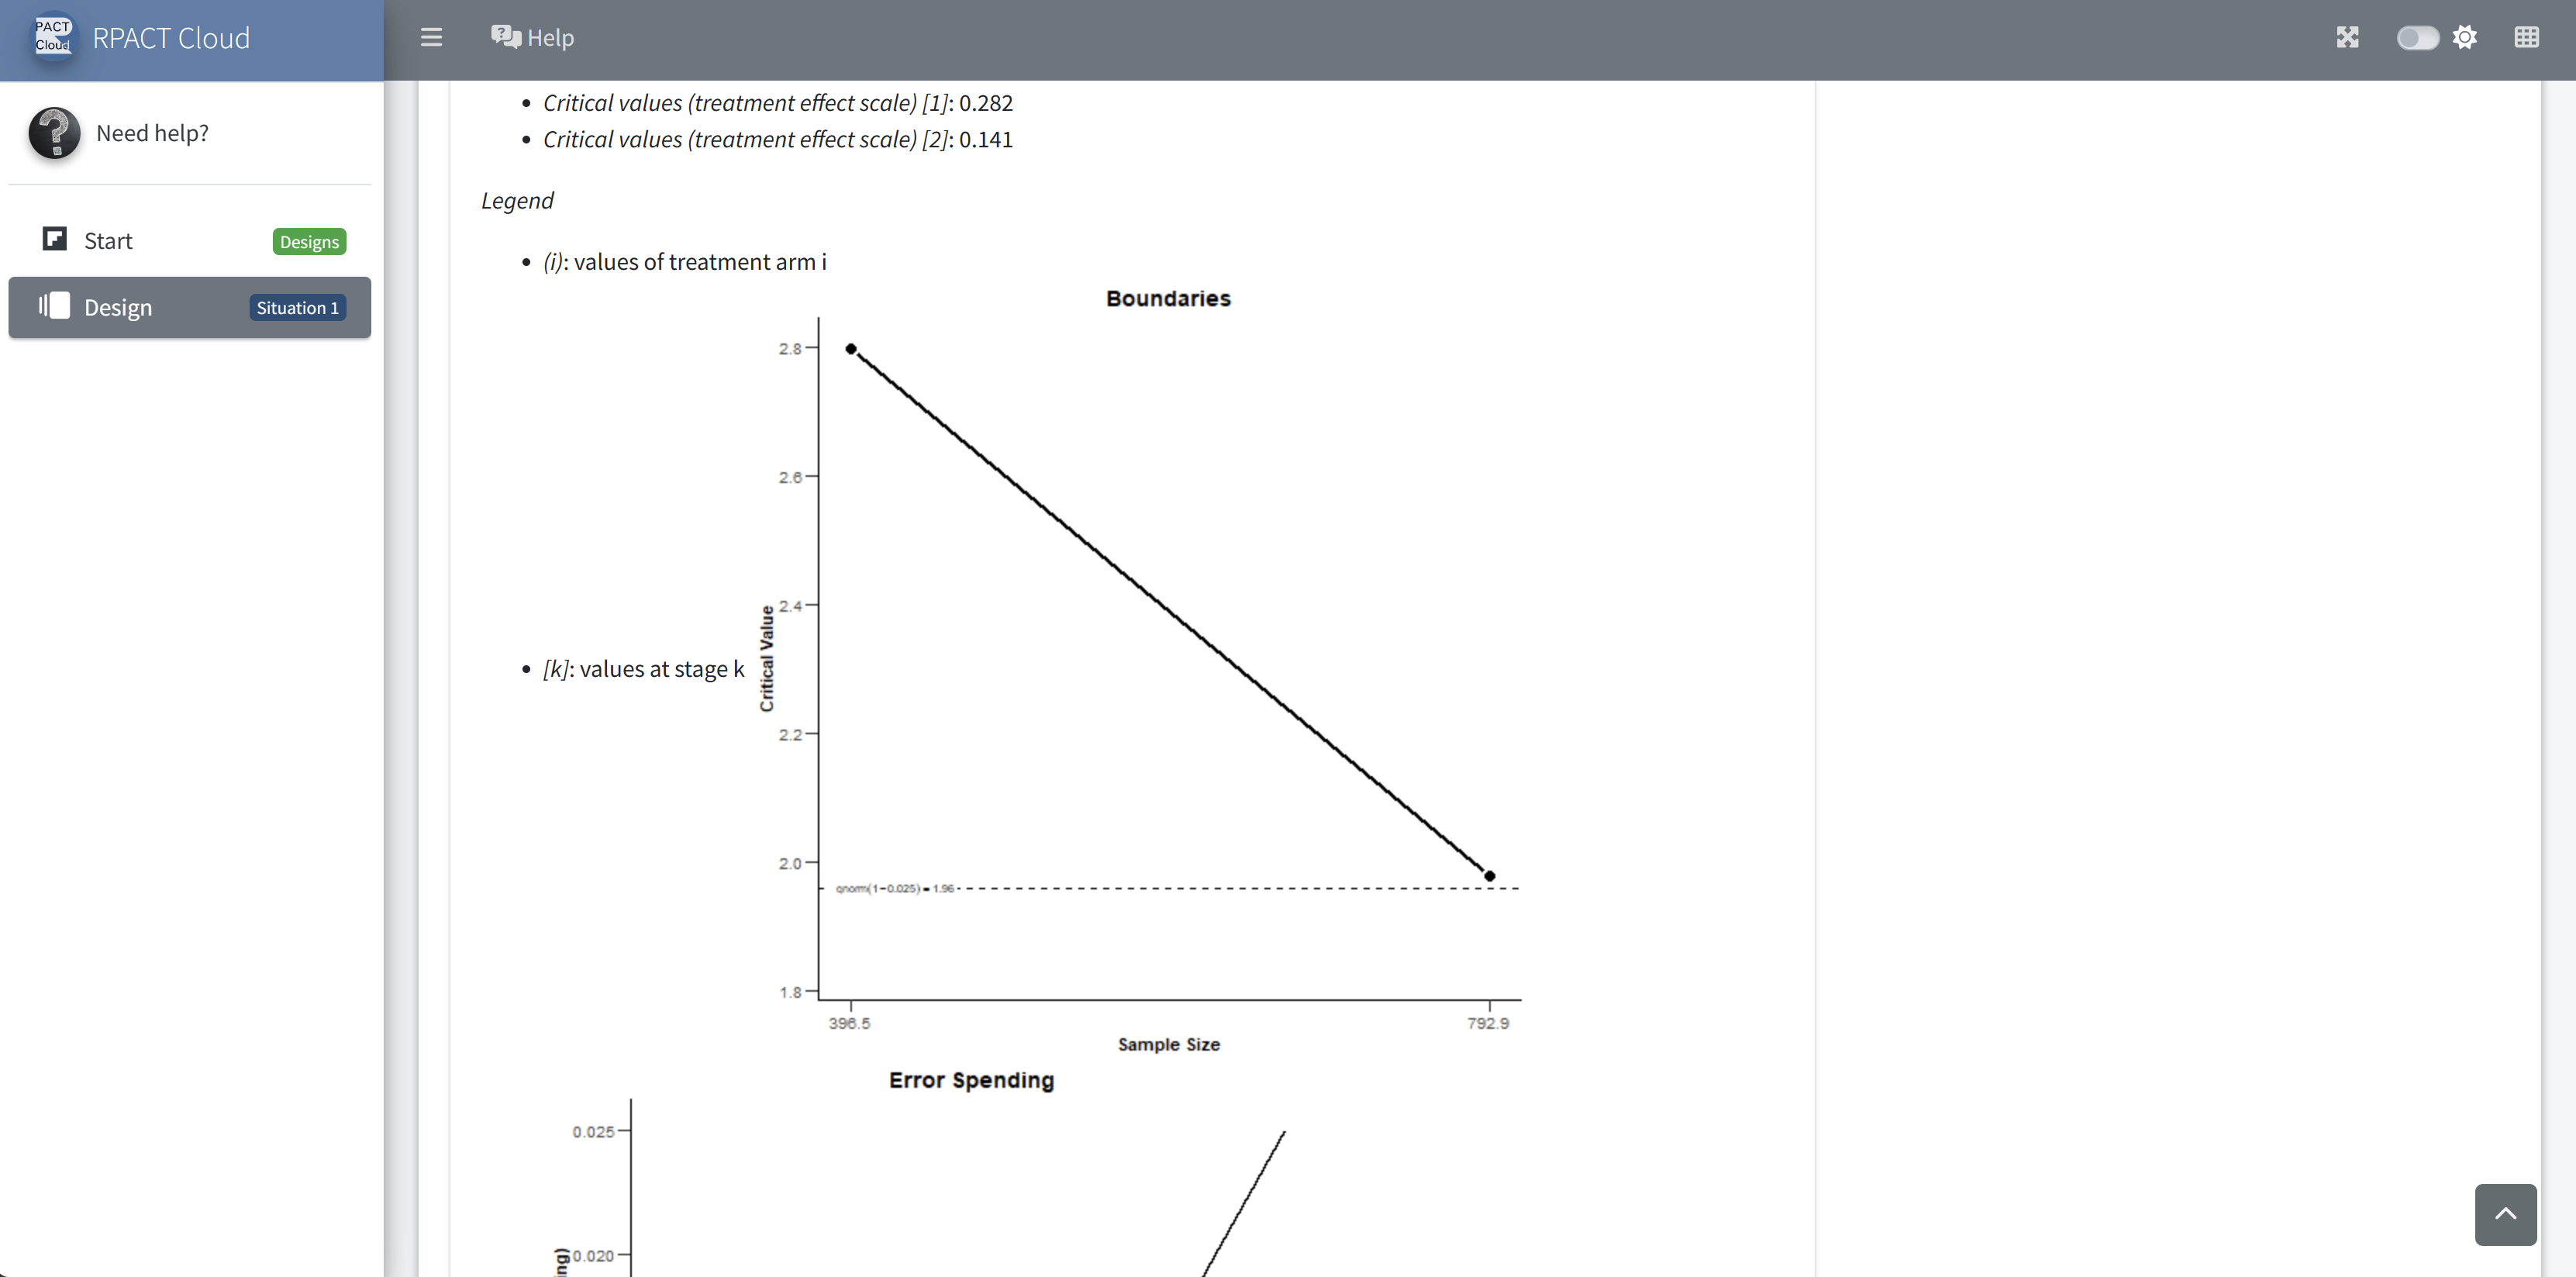
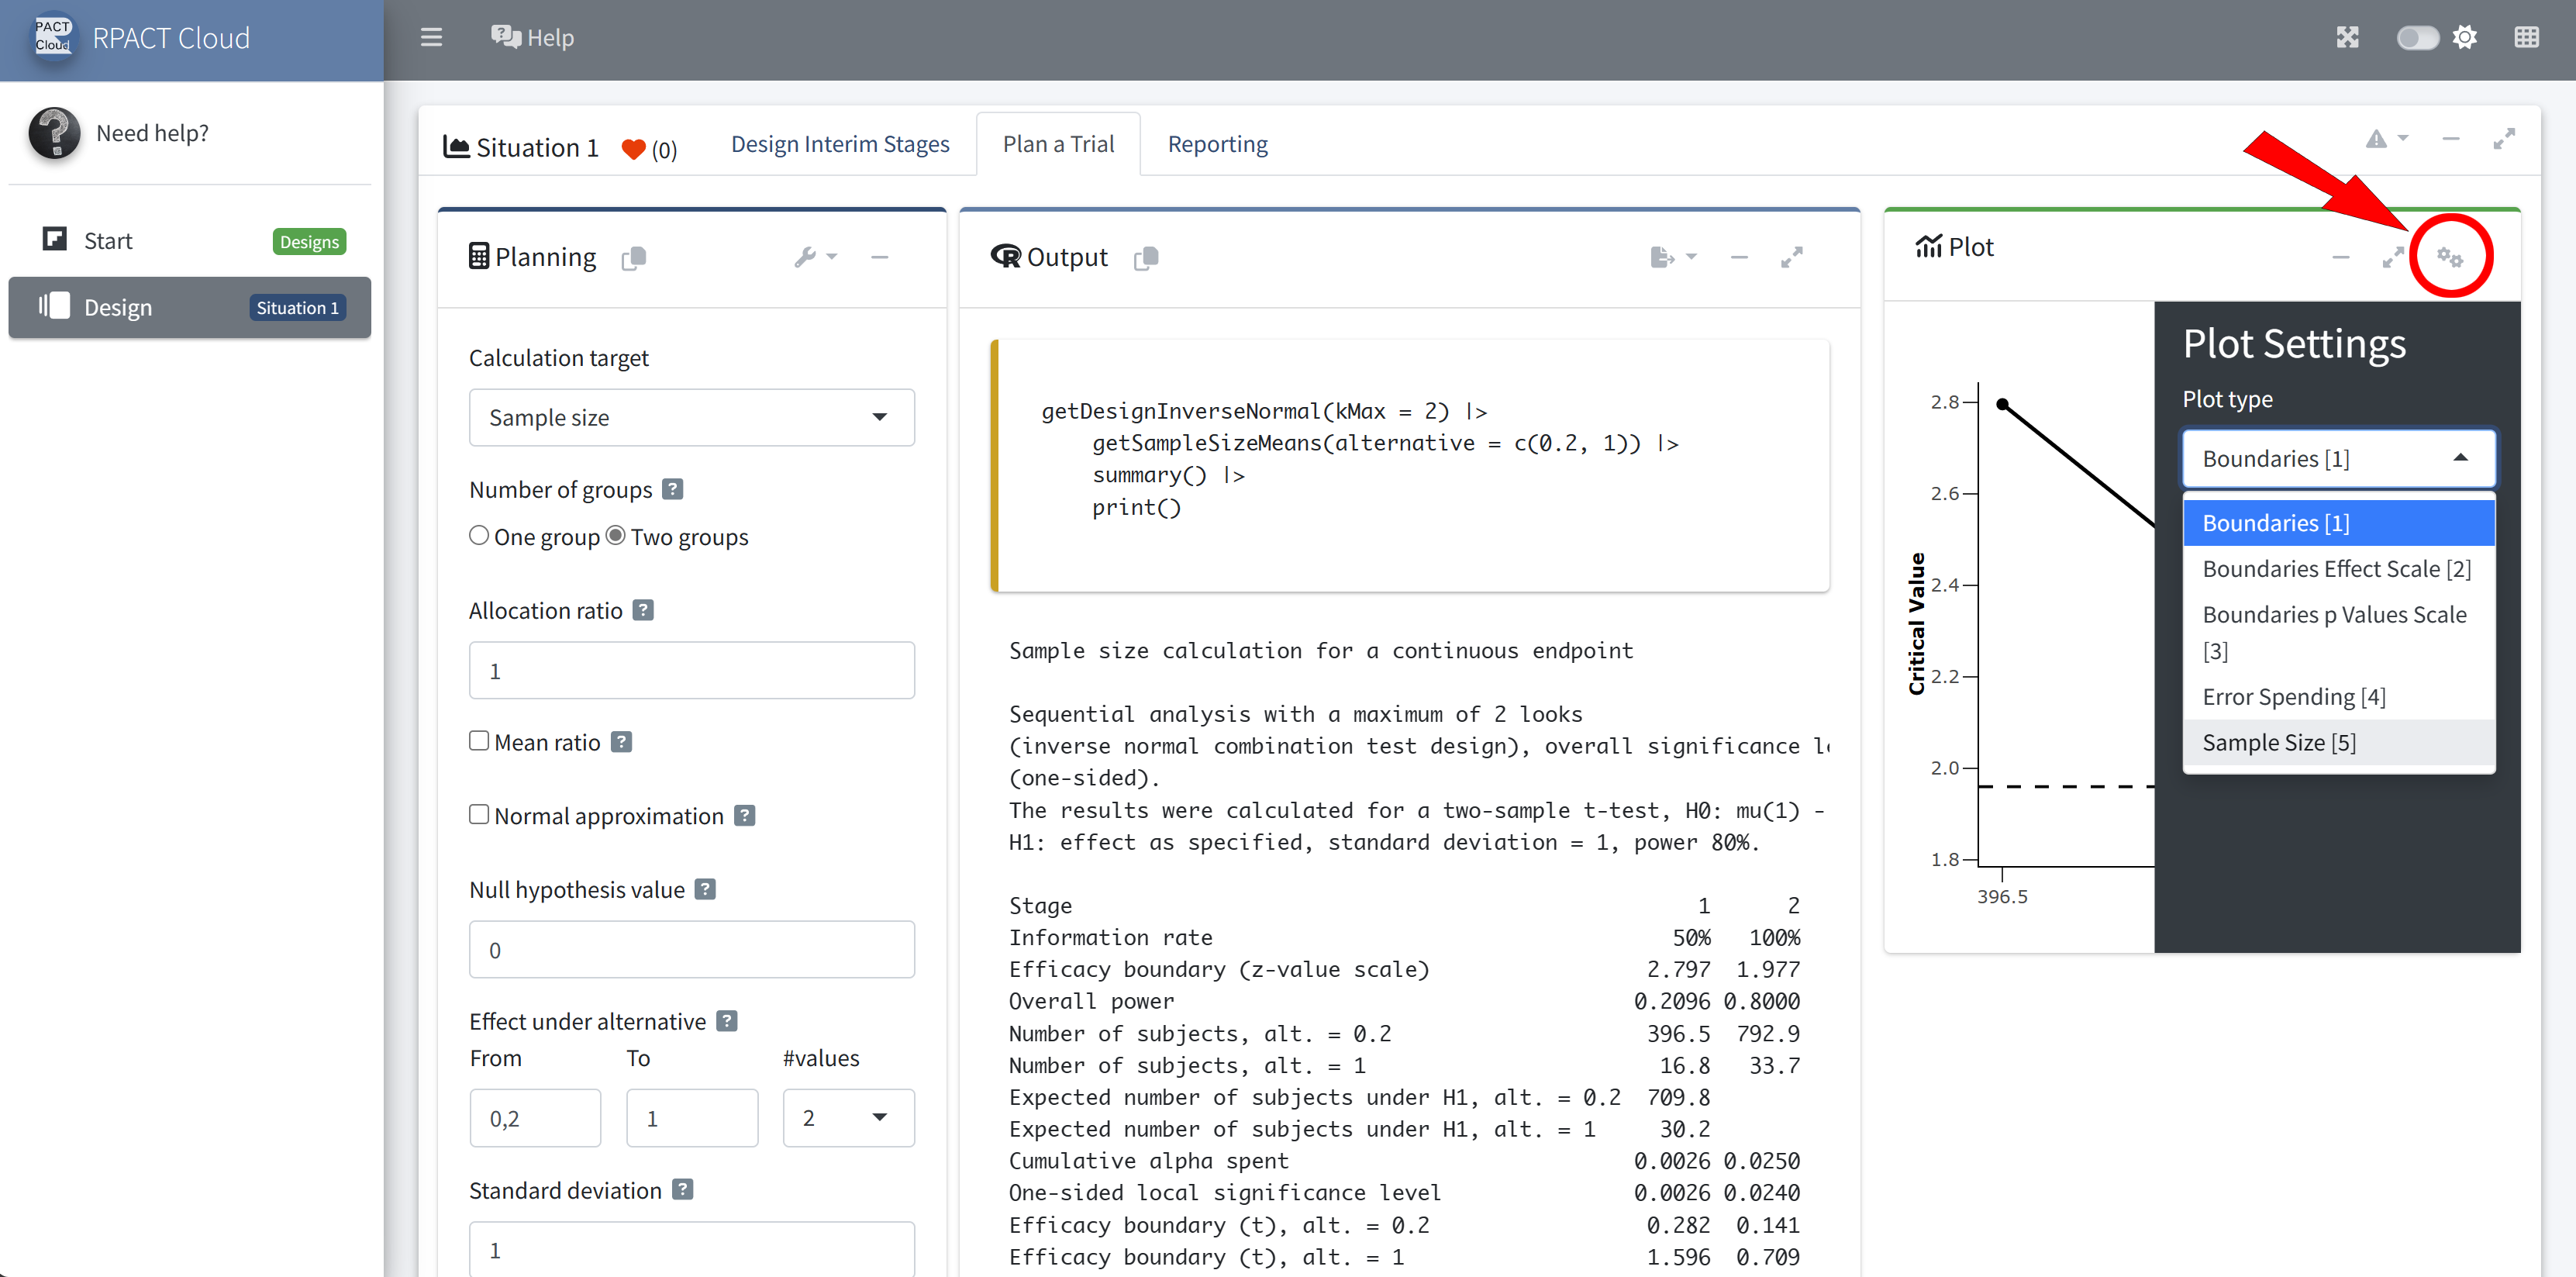
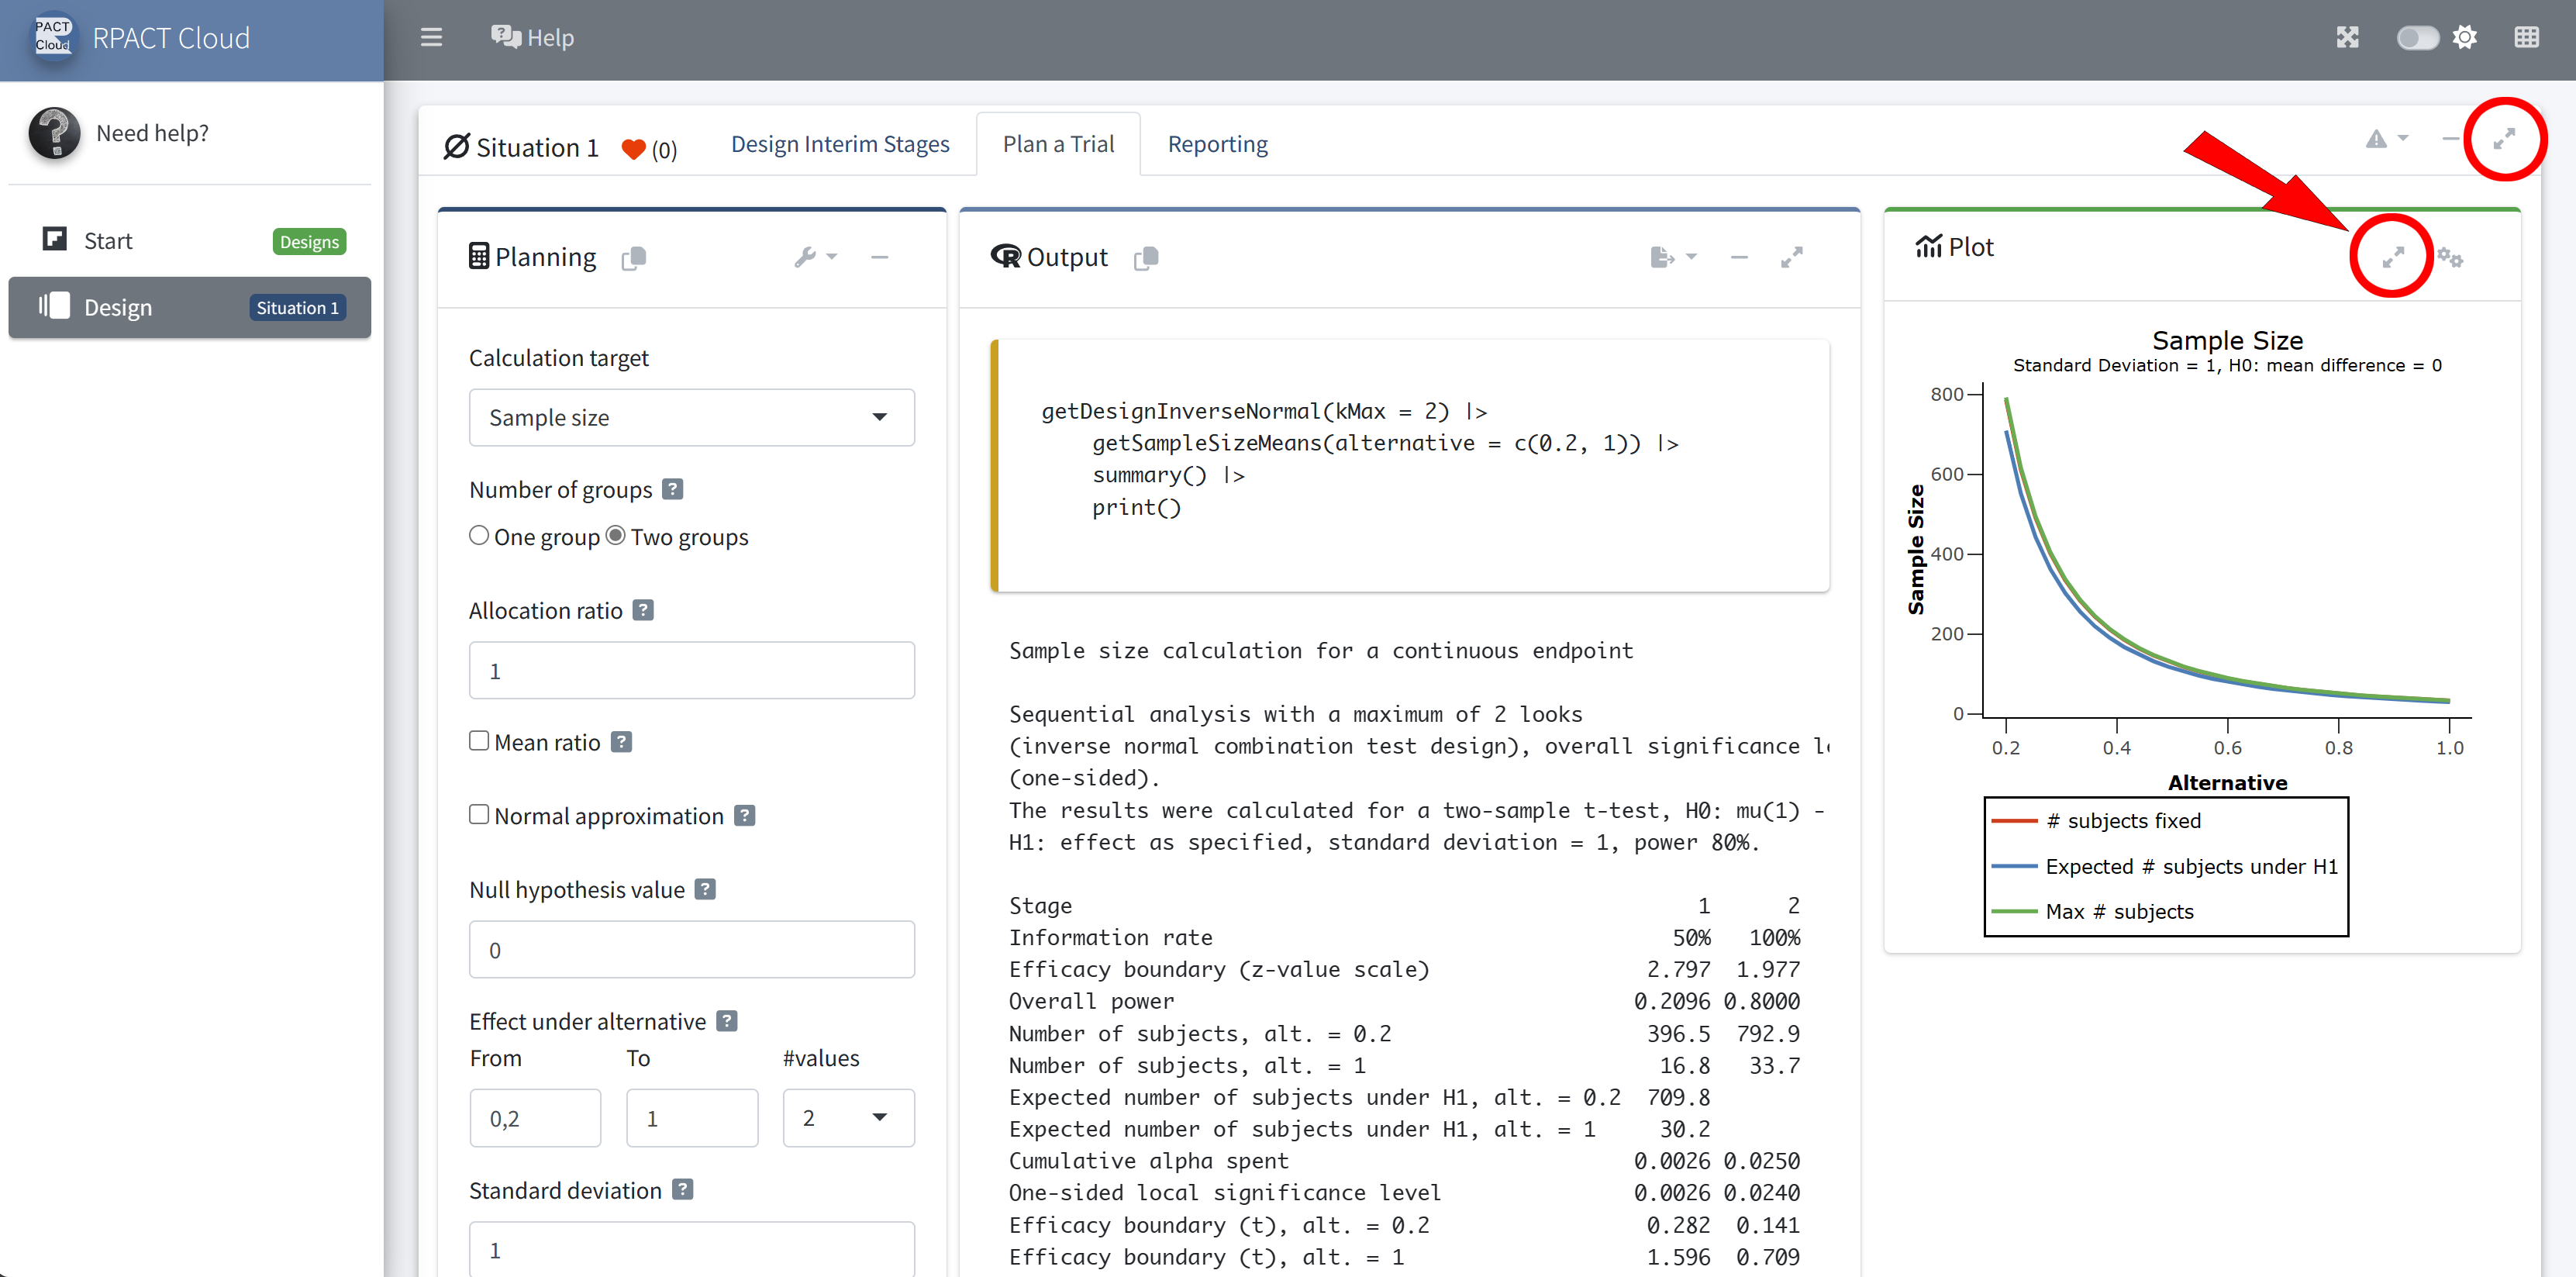
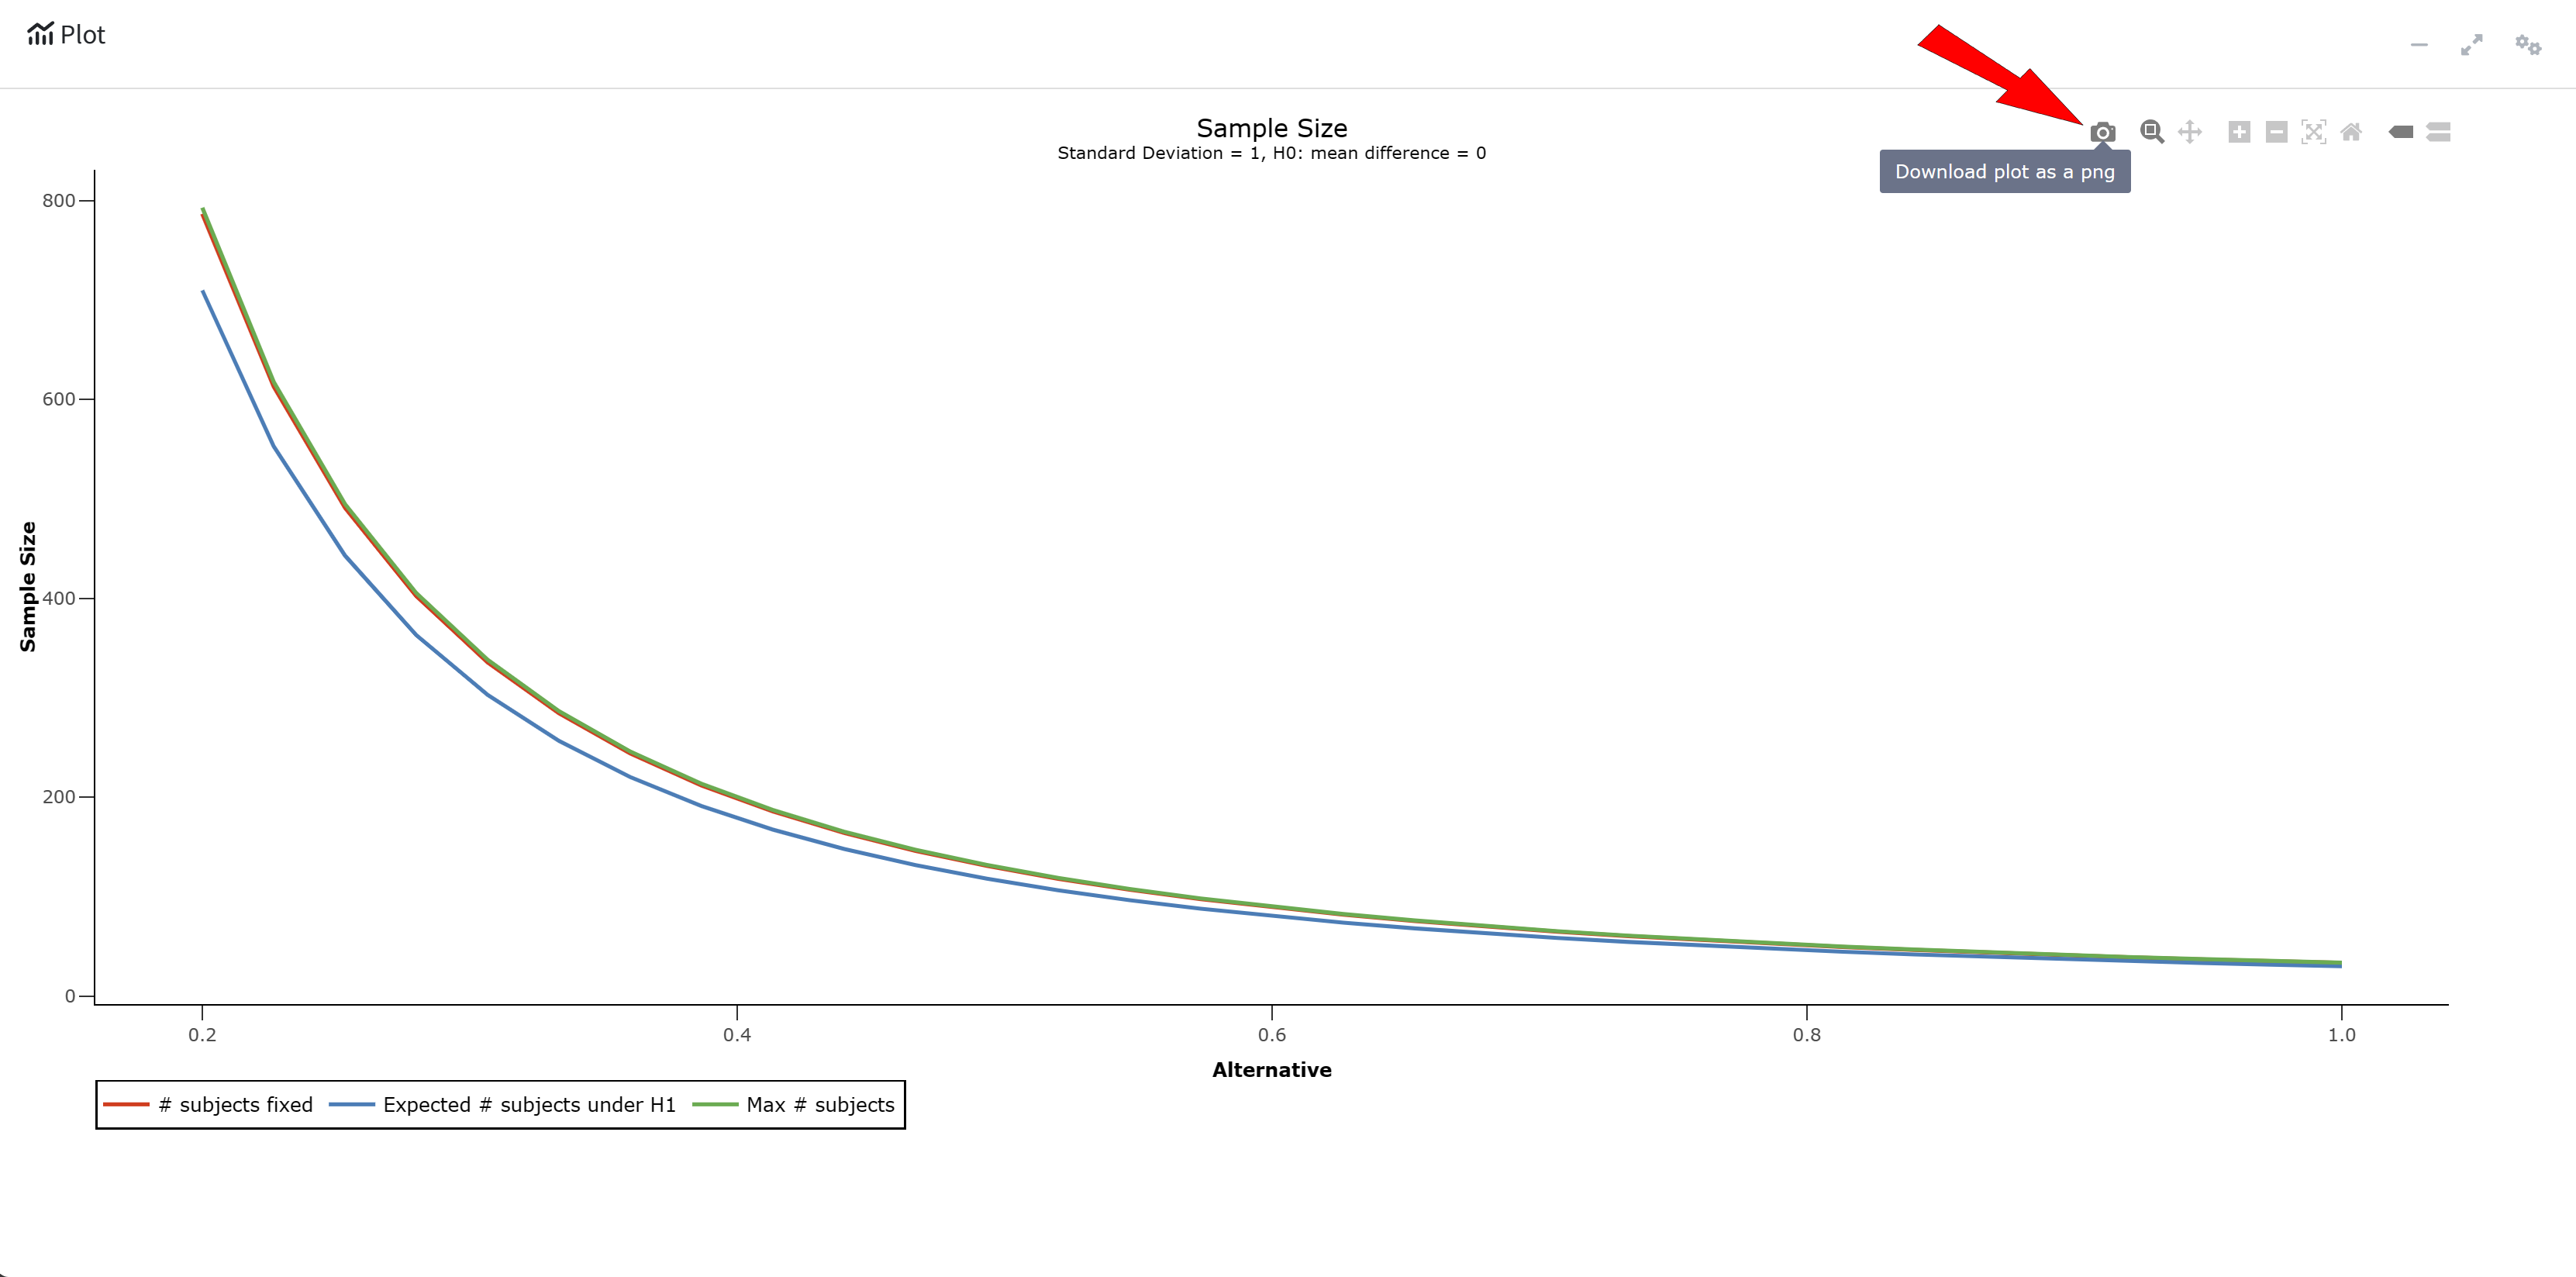
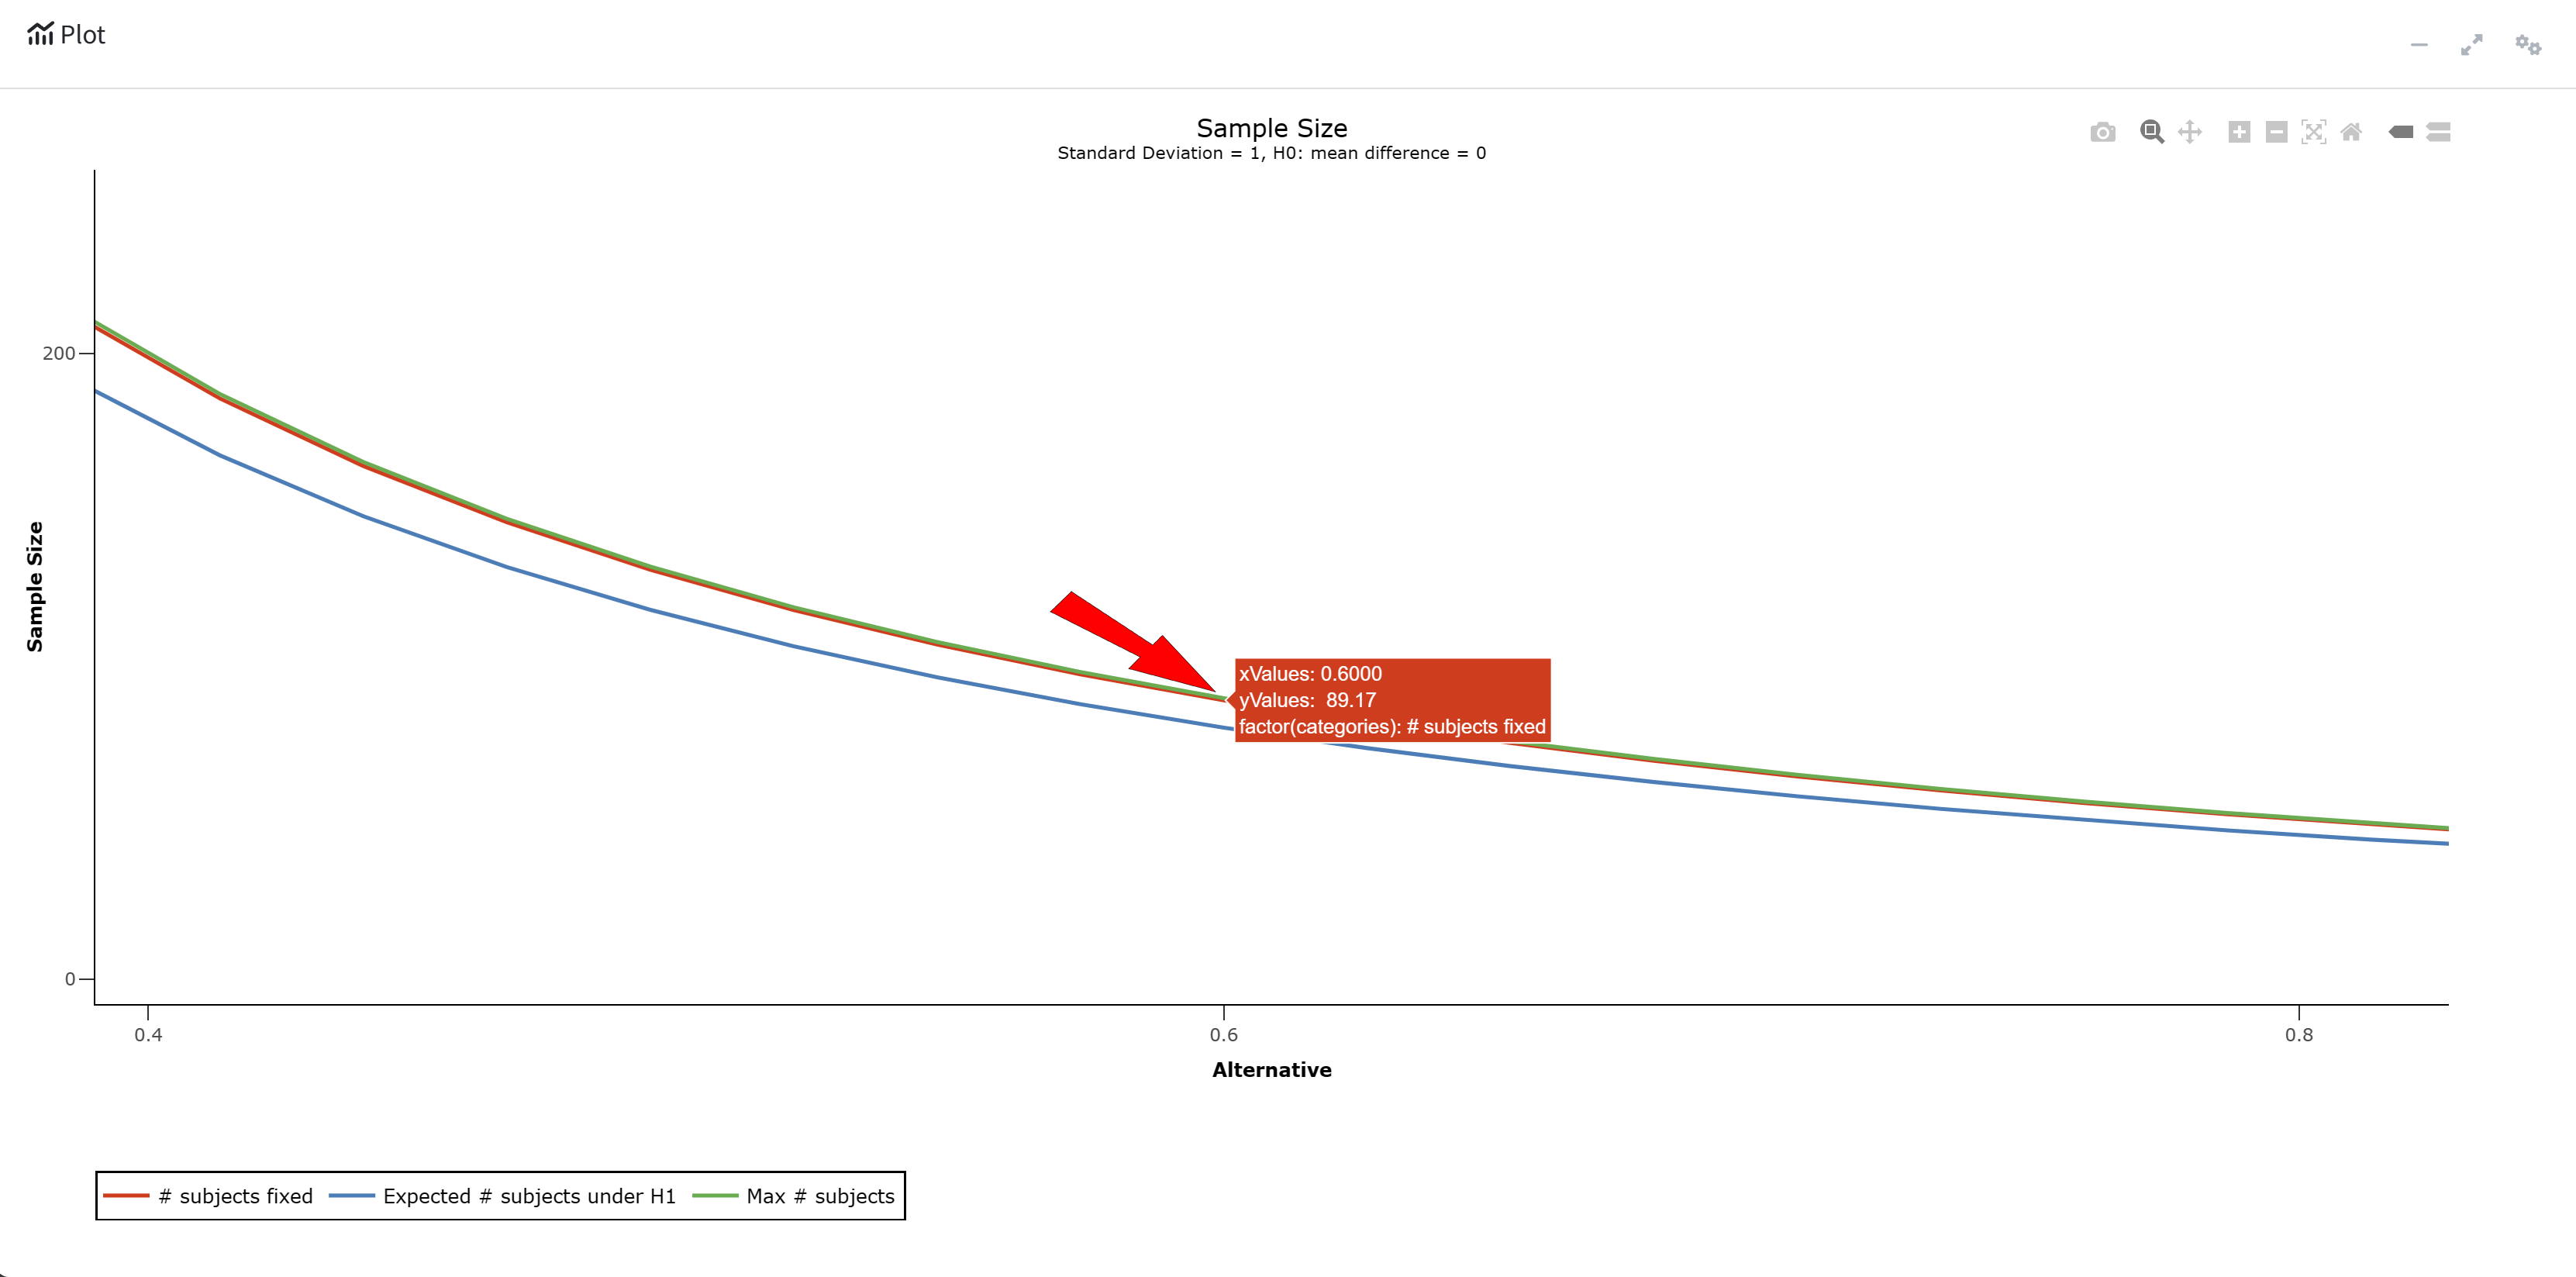
RPACT Cloud – Plotting
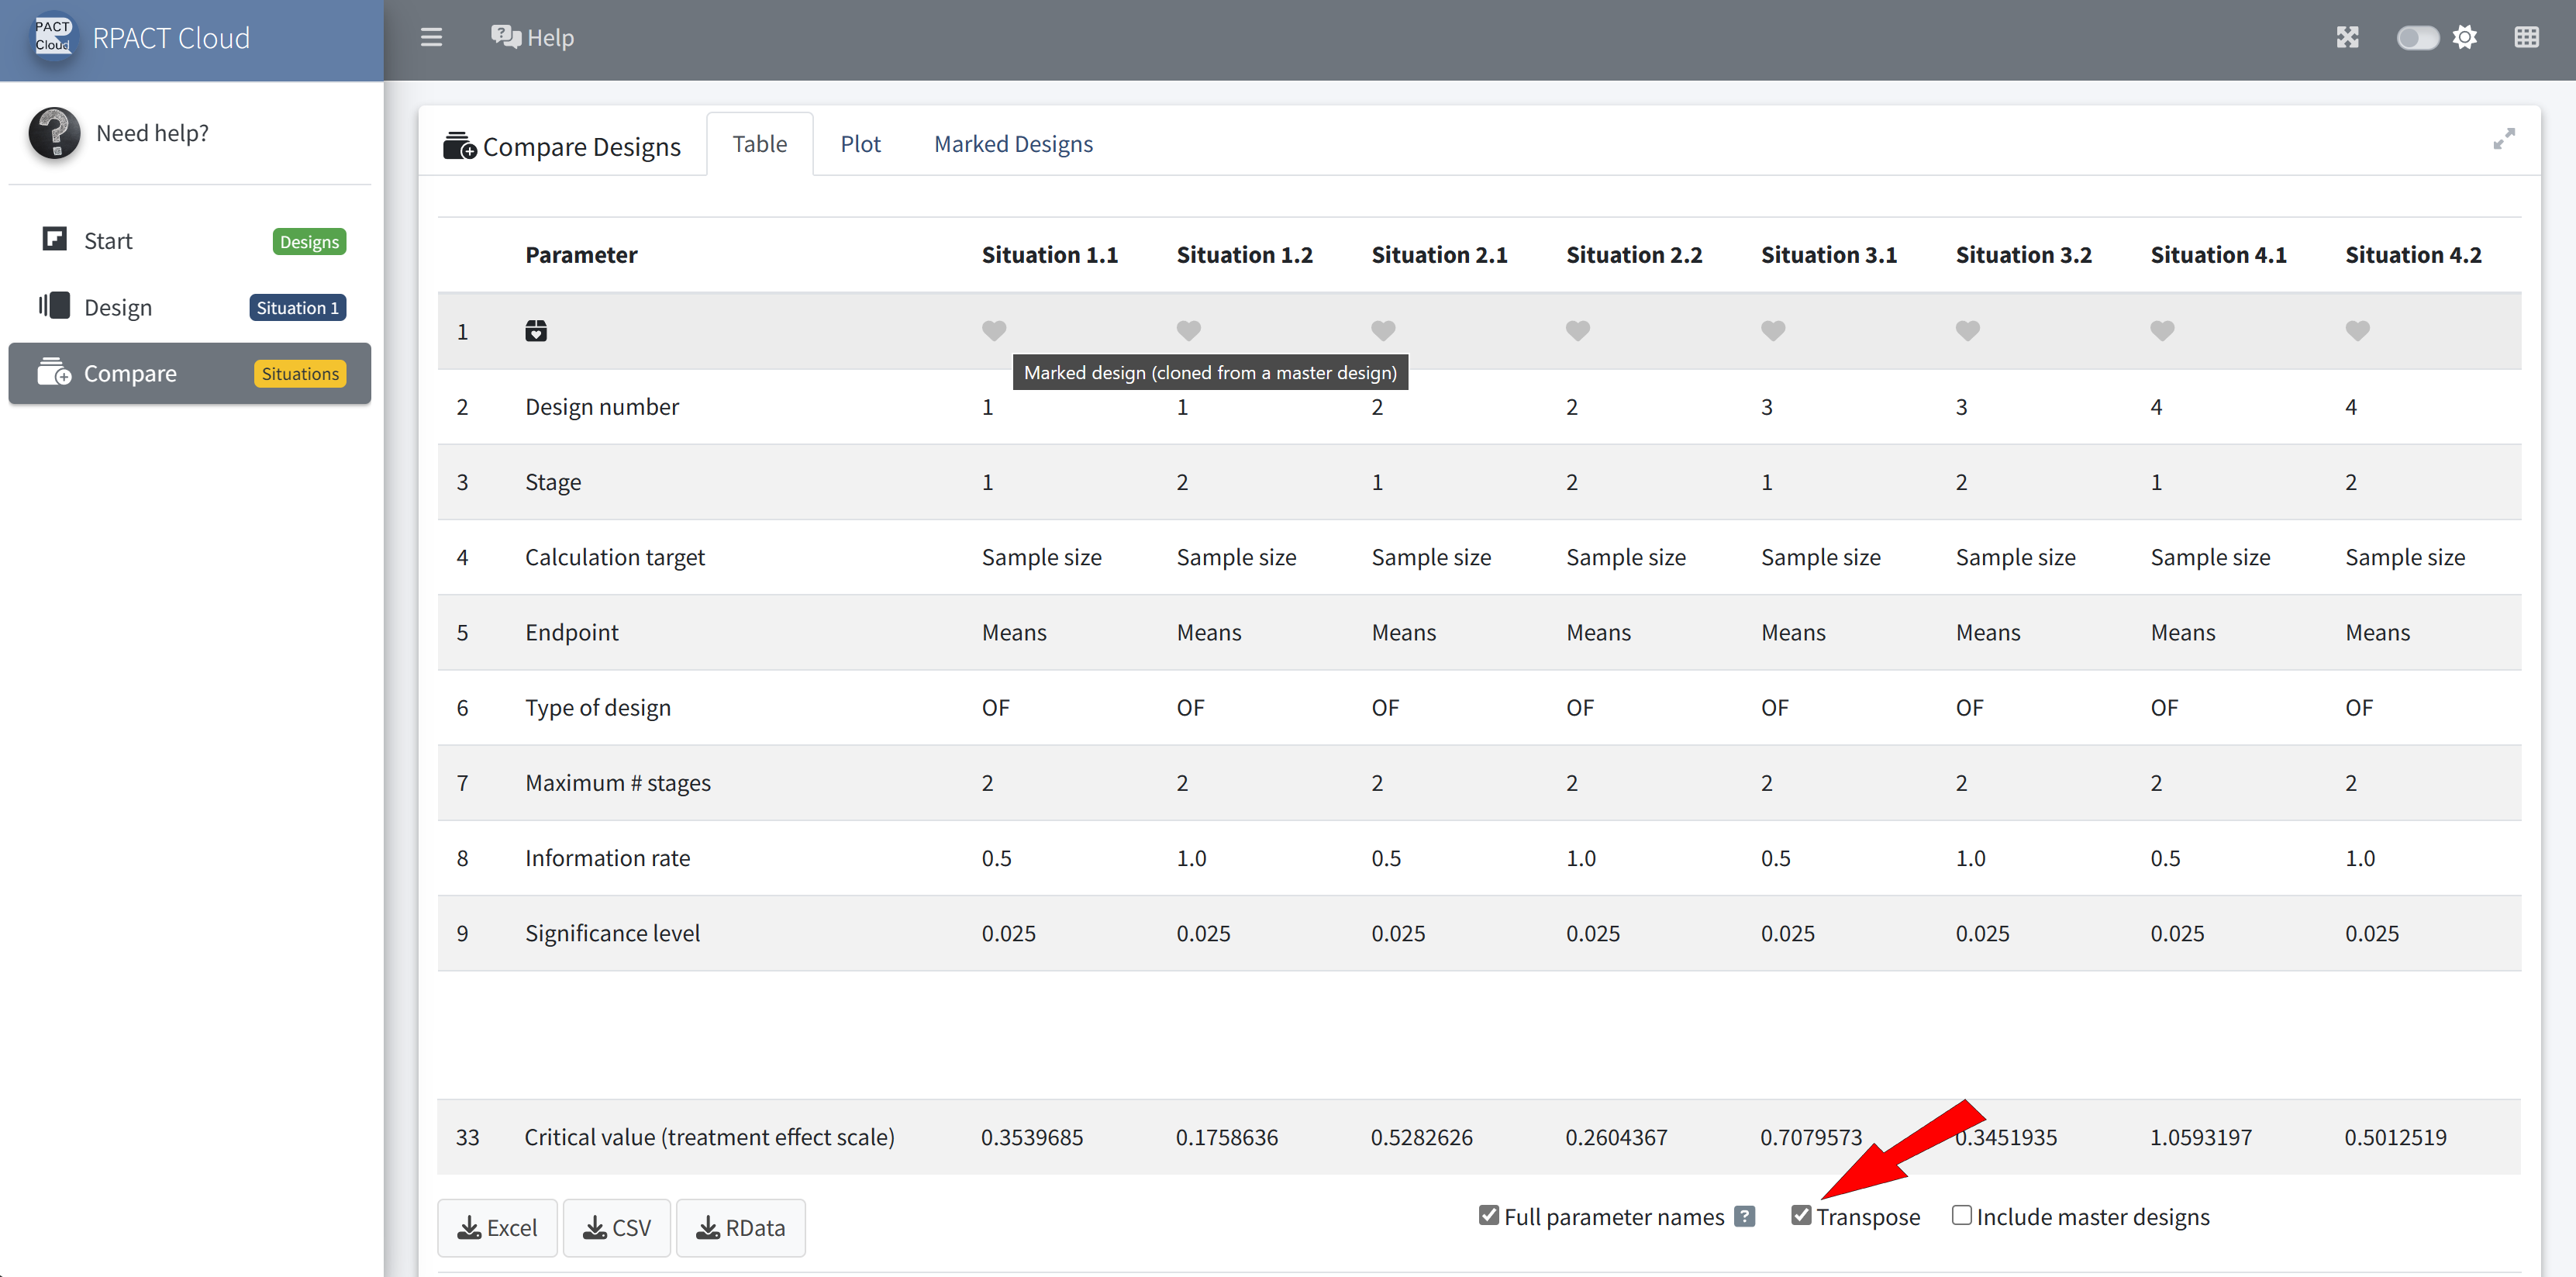
RPACT Cloud – Output Table
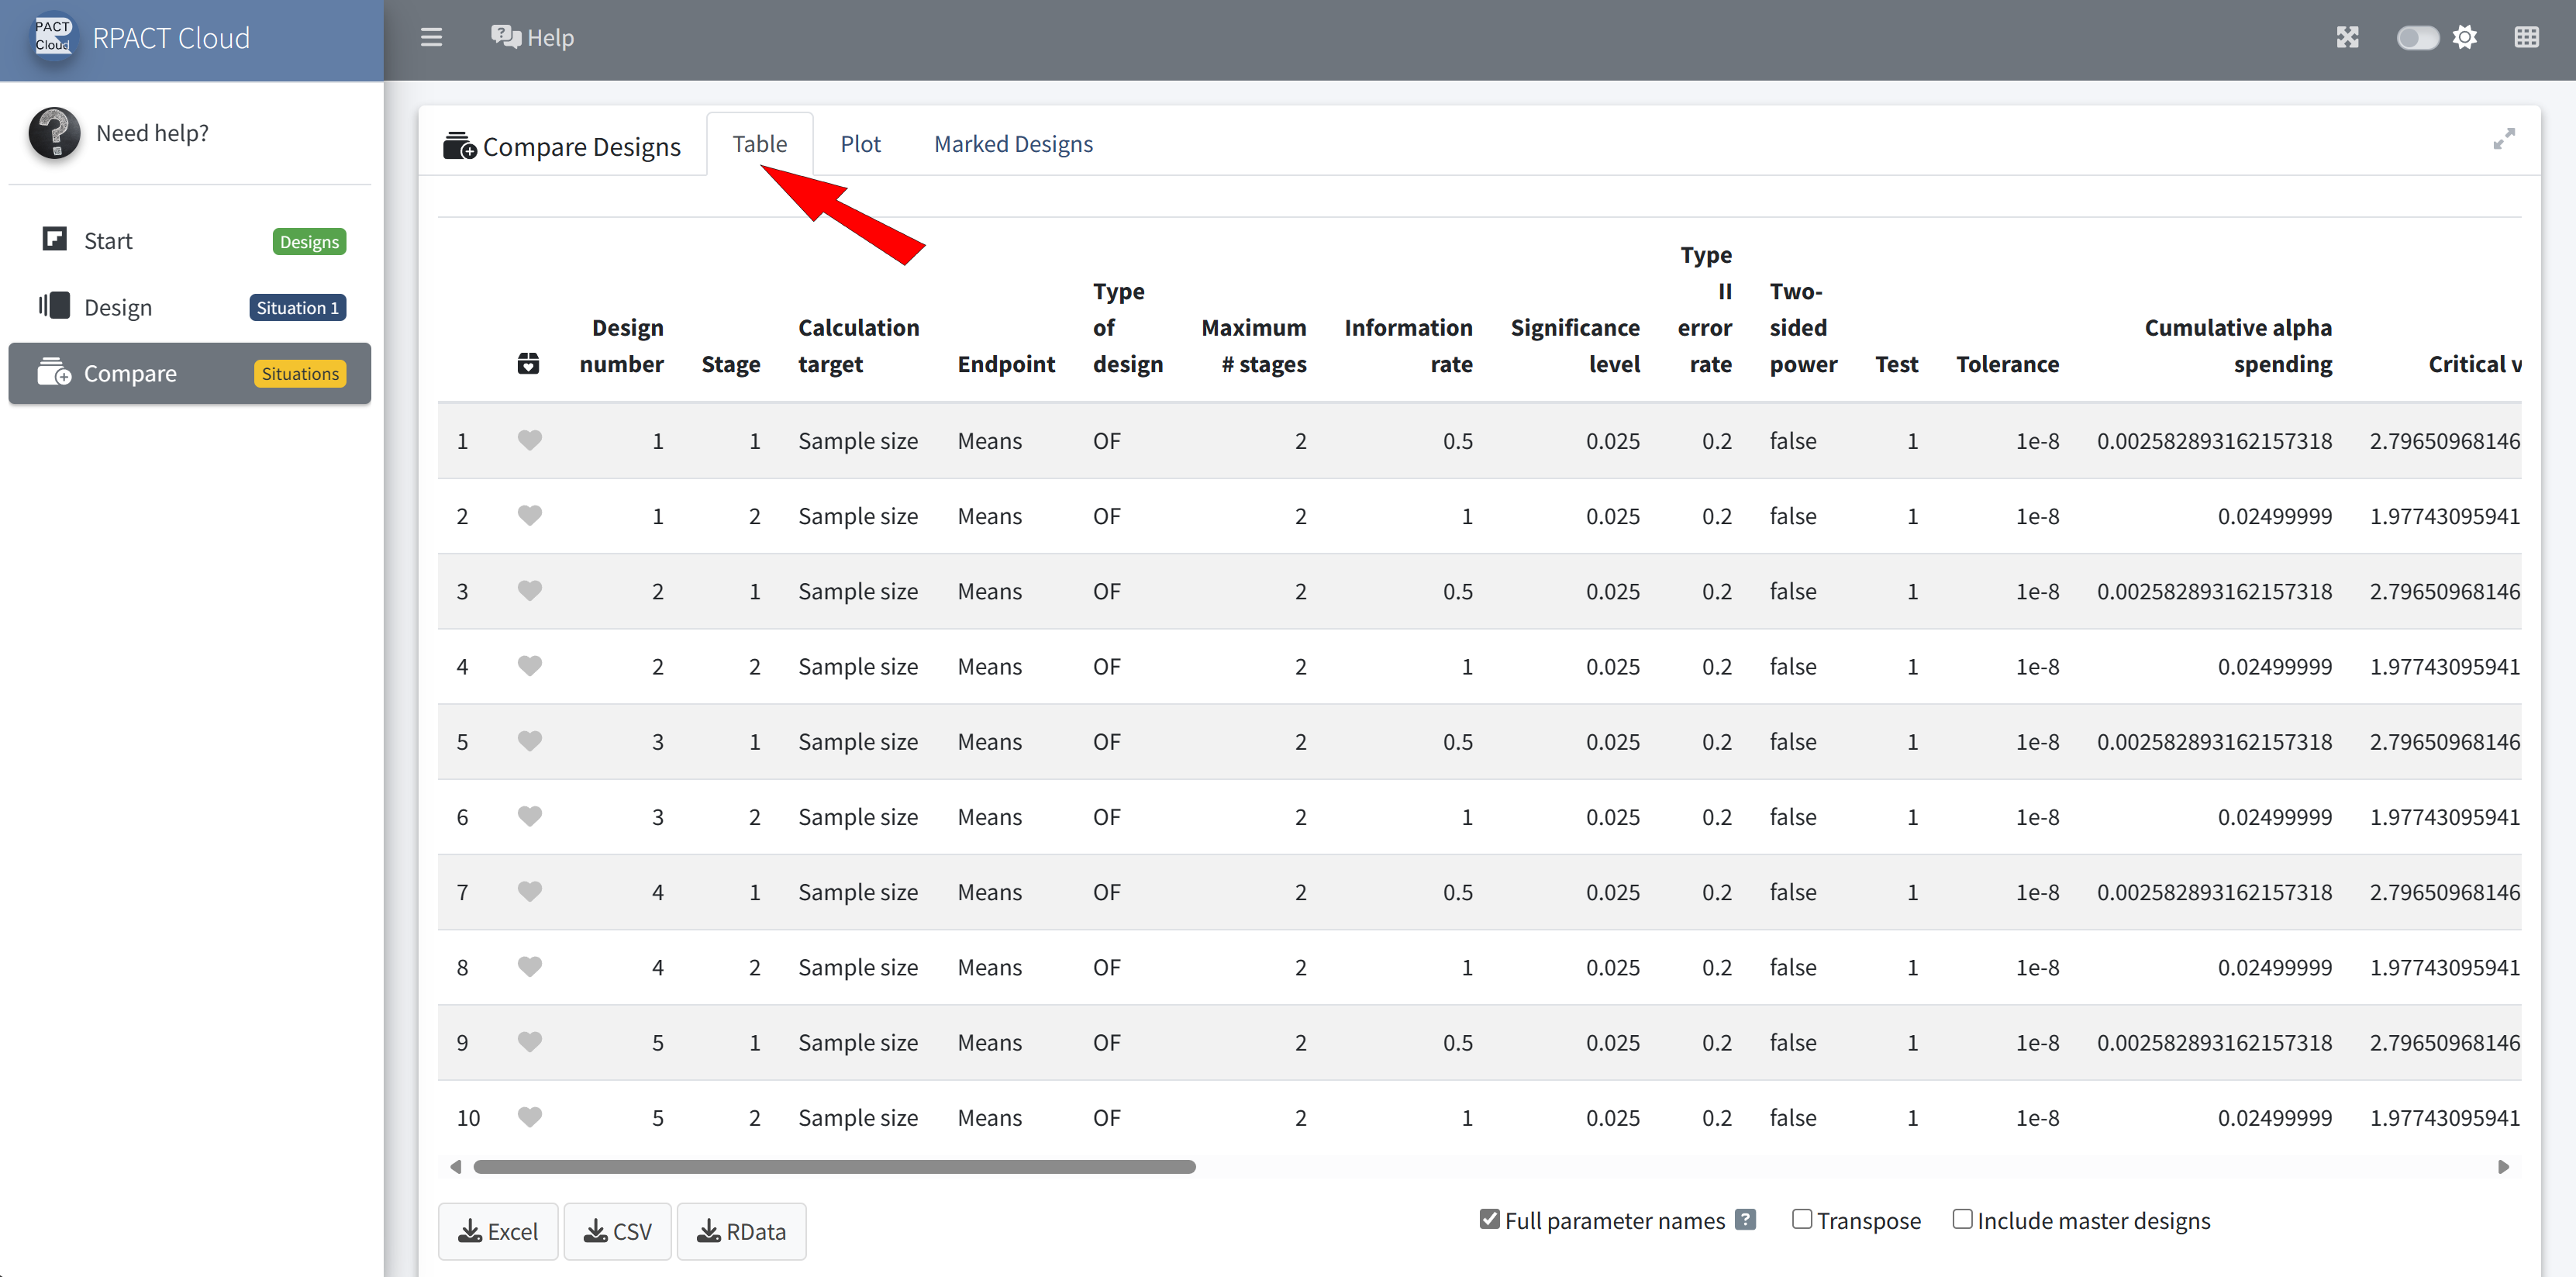
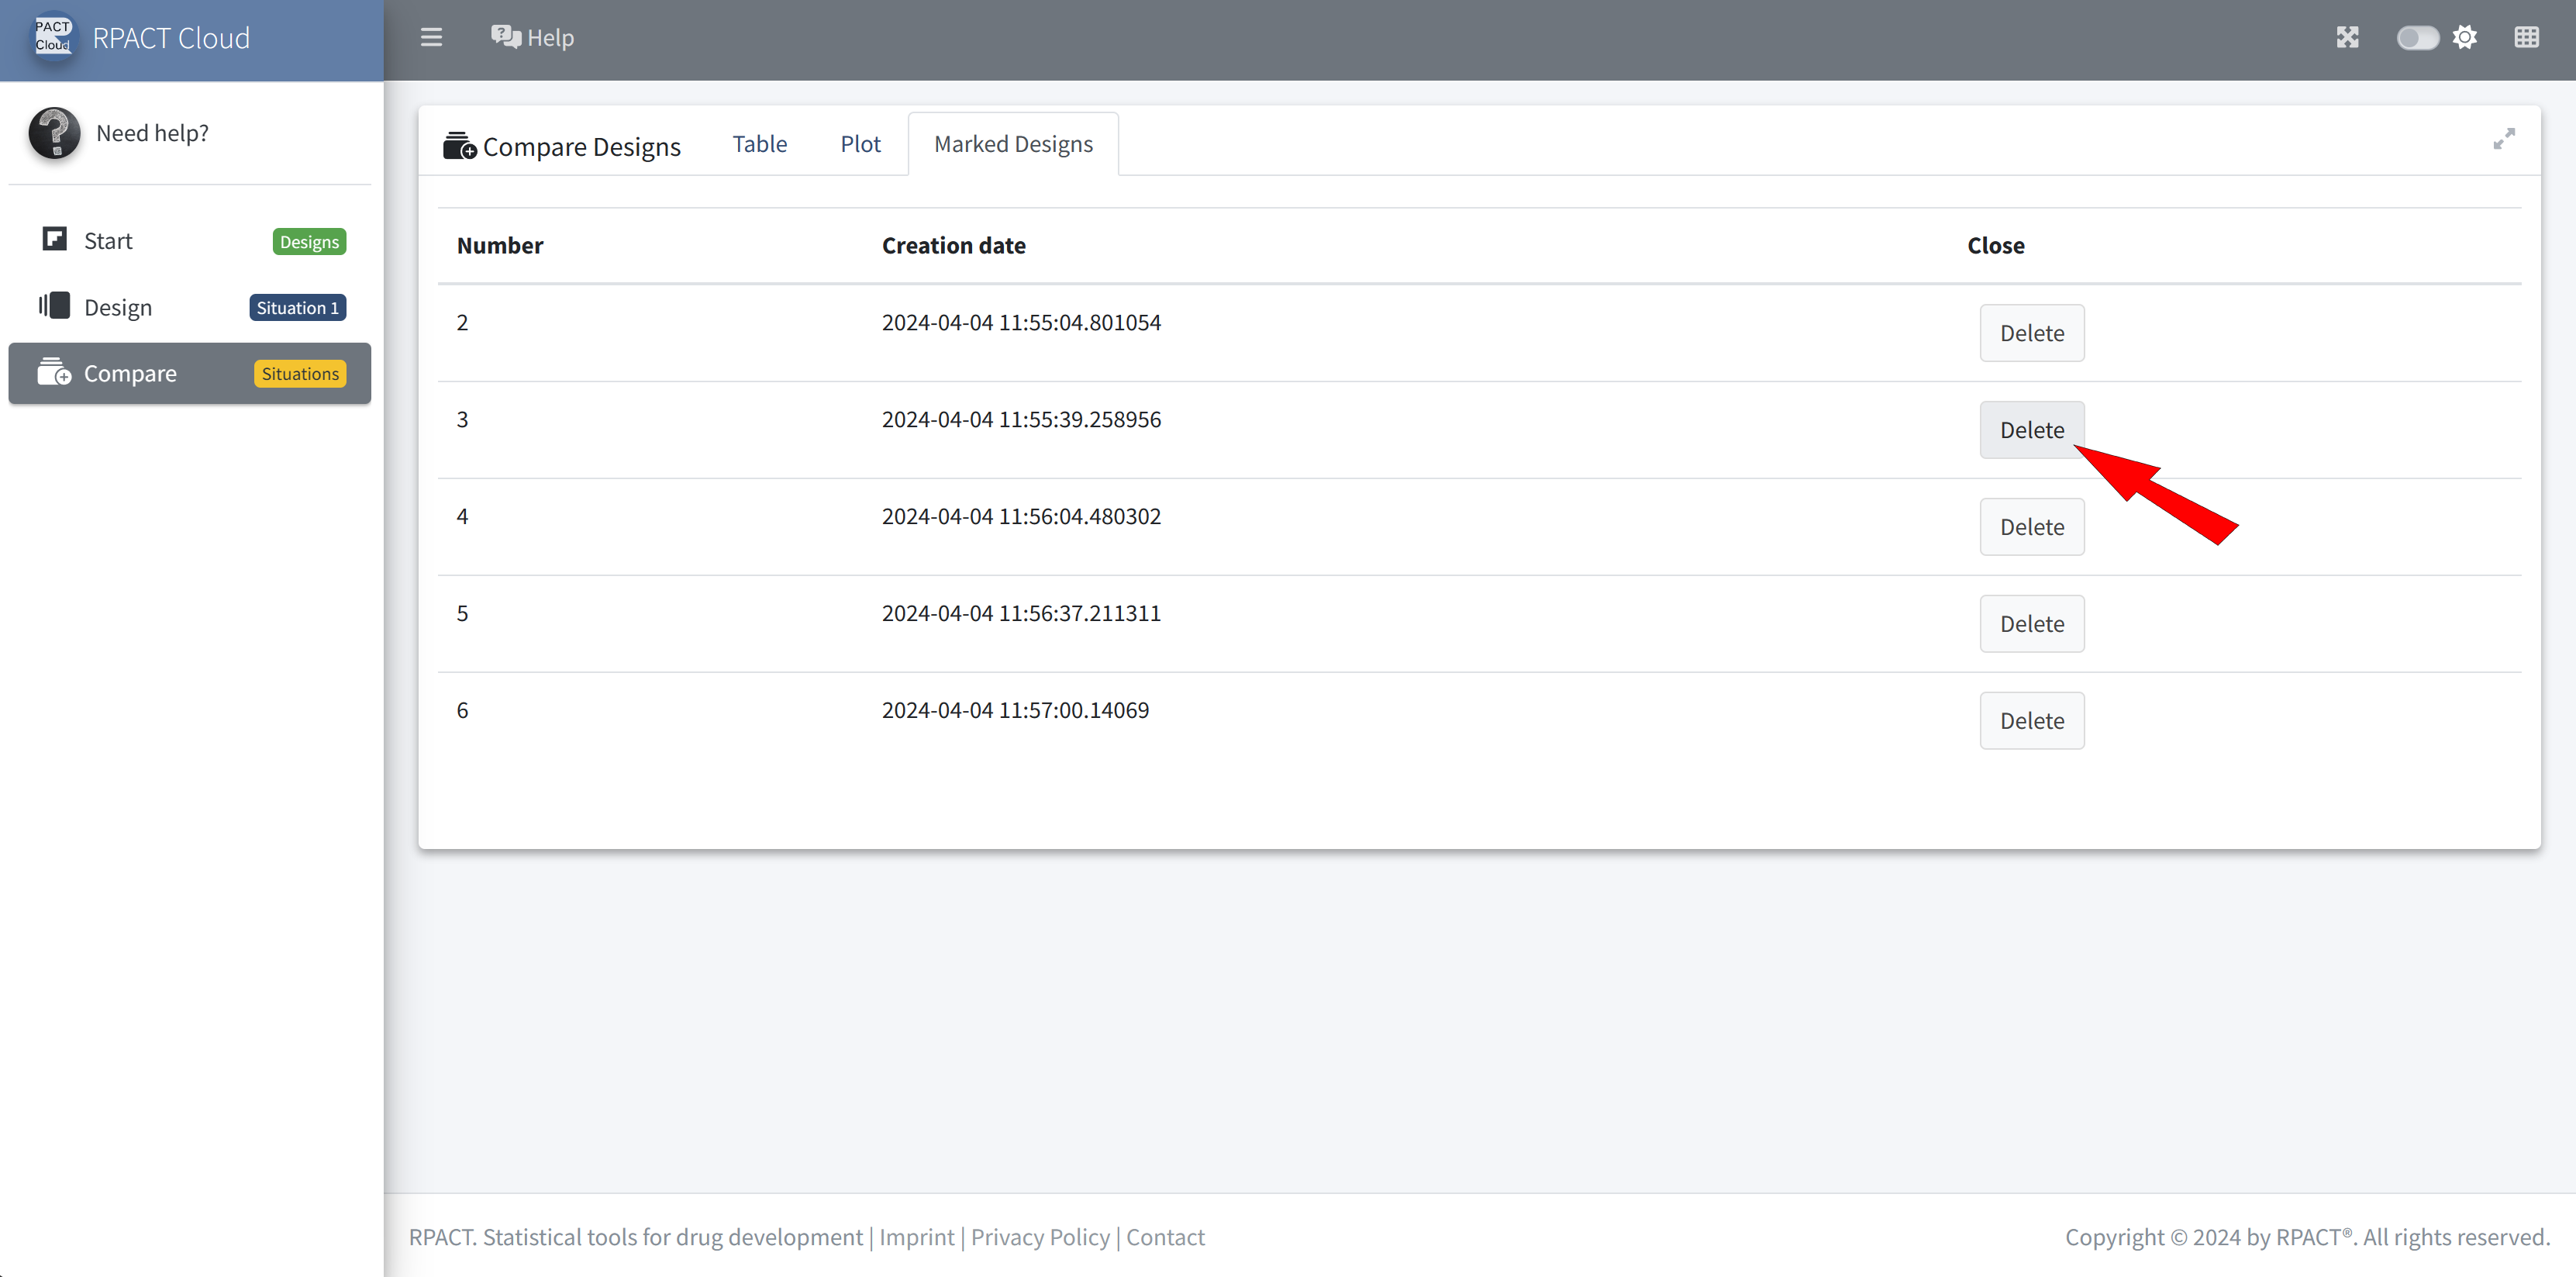
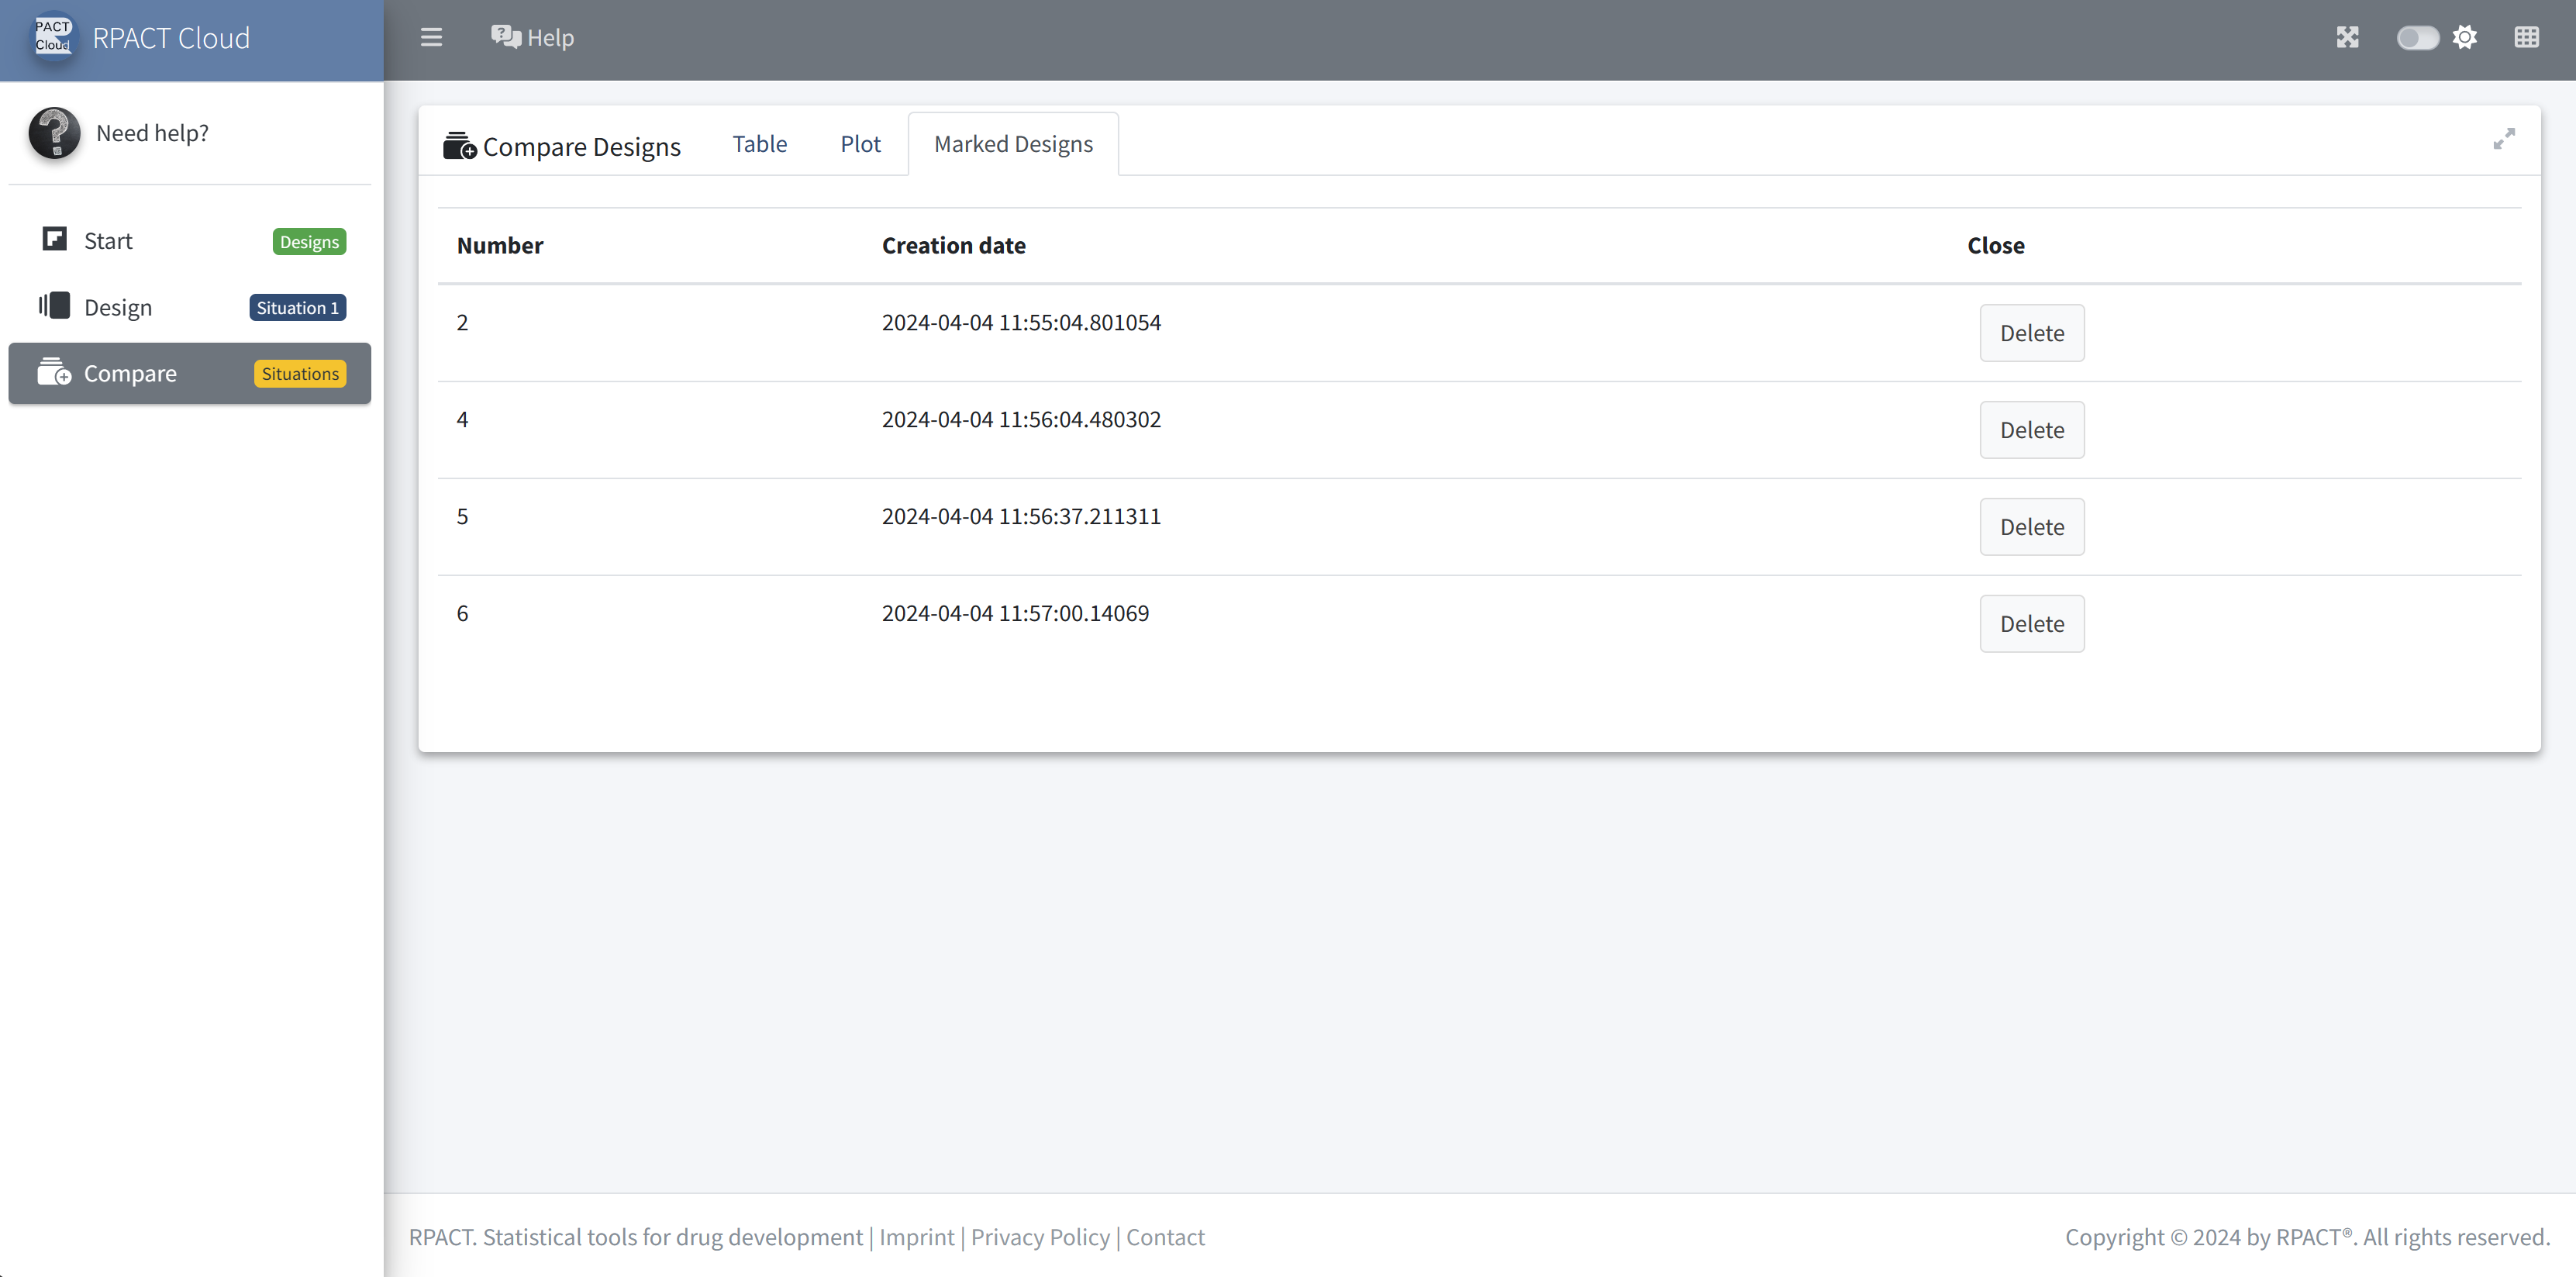
RPACT Cloud – Design Comparison